Wrapped D3.js Visualizations
 Hi! I’m Elizabeth Carney, a senior at Smith College studying Computer Science and East Asian Languages with a concentration in Translation Studies. I’m especially interested in data visualization, robotics, and machine translation. In my free time, I love tinkering in makerspaces
 ![]() , doing nail art
, doing nail art ![]() , and cooking
, and cooking ![]() . To see some of my other projects, check out my GitHub!
. To see some of my other projects, check out my GitHub!
This summer I got to join the WAVES team to develop tools for the next version of Avida-ED. It teaches students about evolution with visual, interactive experiments that run on Avida, a platform for digital evolution research. Avida creates digital organisms and lets them evolve based on various parameters like mutation rate; their survival is always dictated by natural selection, just like it is in the real world. Both softwares were created by the Digital Evolution Lab at Michigan State University.
As WAVES participants, our job was to develop new features for Avida-ED, or reinforce the tools that it uses. For my project, I focused on the development of a mammoth library that Avida is built on: Empirical.
🔗 Empirical and the Internet
Empirical—which was also built by the MSU devolab—is a C++ library for scientific software development. It especially facilitates building evolutionary computation tools, because you can easily create digital organisms and worlds for them to evolve in. Here’s an example of a web app built with Empirical that illustrates evolutionary computation in action!
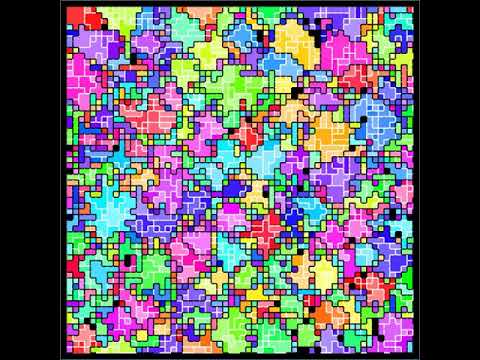
Click the image above for an evolution timelapse!
As you can see, creating a web app is an amazing way to share and showcase your work. Lots of researchers want to publish their experiments and results online so that more people can access and understand them. Luckily, Empirical was built with the internet in mind! Experiments written in C++ can be compiled into super-fast JavaScript using Empirical tools that work with Emscripten. On top of that, lots of web elements are wrapped in Empirical as well, like tables ![]() , animations
, animations ![]() , buttons
, buttons ![]() , text areas
, text areas ![]() , canvases
, canvases ![]() , and more, which means that you can easily create web pages while coding in C++!
, and more, which means that you can easily create web pages while coding in C++!
Data visualization is particularly important to researchers trying to share their results. Incorporating colors and graphics into a report catches the reader’s eye and definitely helps them understand the content better. That’s why (in my opinion) one of the coolest web tools in Empirical’s collection is the C++-wrapped version of D3.js, a JavaScript data visualization library!
🔗 What Does “Data-Driven Documents” Mean?
The “D3” in D3.js stands for Data-Driven Documents, meaning that D3.js allows you to bind data to actual HTML document elements (like circles or lines) instead of abstracting the data binding through some toolkit. Because of that, using the library is an exceptionally transparent process. As a bonus, all of the visualizations you create with D3.js are SVGs; that means they’re scalable and won’t get “fuzzy” because the graphics are based on equations instead of pixels.
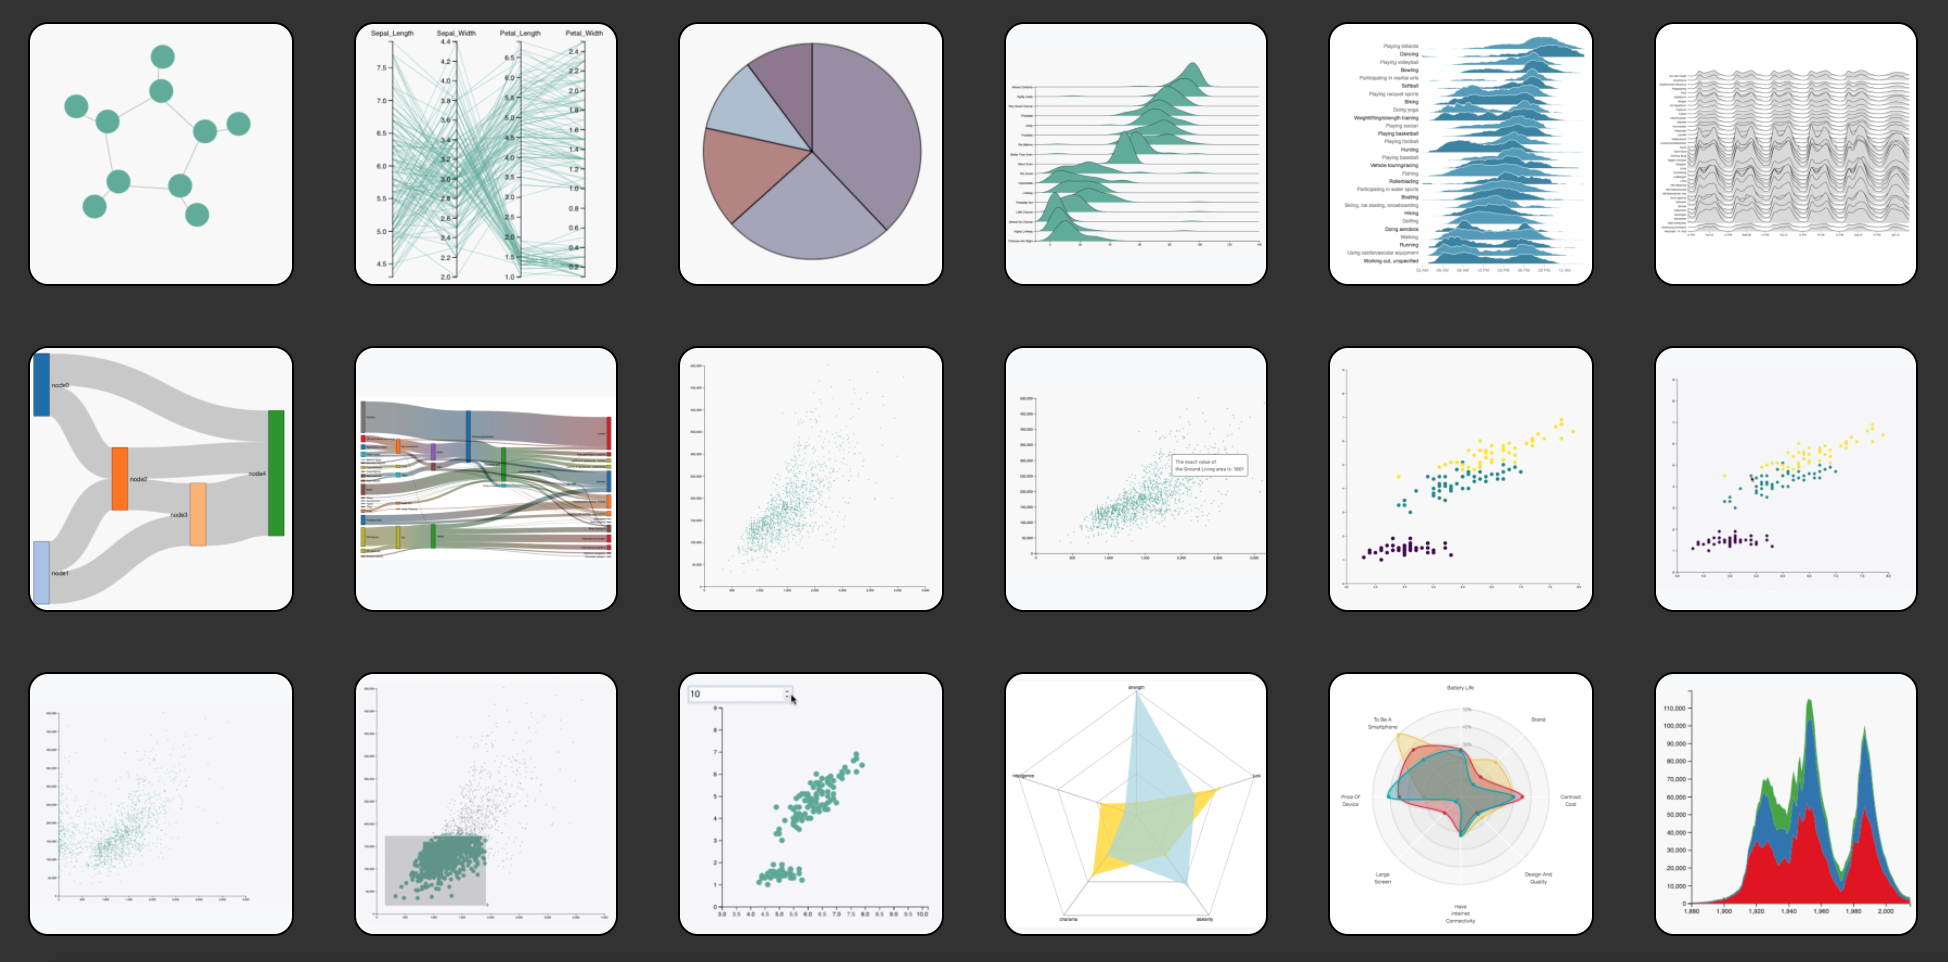
Here are some examples of the different visualizations you can create with D3.js!
One downside to D3.js is that it doesn’t come with any pre-packaged visualizations out of the box. Whether you want a line graph, histogram, scatterplot, or something entirely different—you have to build it yourself out of axes, circles, and other simple elements. There’s a beauty to this system, though. The D3.js community is huge and very active, so there are tons of examples of building all types of visualizations online (see this gallery to start!). And, if you want, you can customize your graph endlessly until it’s exactly how you want it.
D3.js had already been wrapped for Empirical a few years ago by Dr. Emily Dolson at the devolab, but a new version came out since then and it needed to be revamped. ![]() So, I took on the project of updating the Empirical D3-wrapper over the summer along with Oliver Baldwin Edwards and my two amazing mentors, Dr. Emily Dolson and Alex Lalejini!
So, I took on the project of updating the Empirical D3-wrapper over the summer along with Oliver Baldwin Edwards and my two amazing mentors, Dr. Emily Dolson and Alex Lalejini!
🔗 Wrapping a Library
![]() The number-one reason to wrap D3.js in C++ for Empirical was convenience. Many researchers want to be able to code data visualizations that integrate seamlessly into their C++-based experiments and web apps.
The number-one reason to wrap D3.js in C++ for Empirical was convenience. Many researchers want to be able to code data visualizations that integrate seamlessly into their C++-based experiments and web apps.
![]() And, if the original library goes through frequent changes, then having a wrapper can make it easier to update things on your end (you only have to change the code inside the wrapper).
And, if the original library goes through frequent changes, then having a wrapper can make it easier to update things on your end (you only have to change the code inside the wrapper).
![]() Moreover, using Emscripten to compile C++ into JavaScript results in wicked-fast (near-native!) code on the web side.
Moreover, using Emscripten to compile C++ into JavaScript results in wicked-fast (near-native!) code on the web side.
![]() However, it’s important to note that we definitely wanted the wrapper to be recognizable to people who’d used D3 in JavaScript before. We needed to strike a balance between convenience in C++ and similarity to JavaScript.
However, it’s important to note that we definitely wanted the wrapper to be recognizable to people who’d used D3 in JavaScript before. We needed to strike a balance between convenience in C++ and similarity to JavaScript.
Basic D3-wrapper structure: Each D3.js module (e.g. selection, transition, axis, scale, etc.) has its own header file in Empirical/source/web/d3. Some modules, like scales, contain a base class for shared methods as well as other classes that build off of it. Each D3.js method has a wrapped equivalent, though a method might be templated or have multiple versions in the C++ code because its corresponding D3.js method could take several different types of input or return several different types of output. On the JavaScript side, a huge array called emp_d3.objects stores every single D3 object you create.
In the process of wrapping D3.js for Empirical, we:
- rewrote function calls to match the current version of D3.js
- added functionality to make using the library from C++ even easier
- wrote new functions to help us pass complex data types between C++ and JS cleanly
- replaced outdated macros with new methods in our custom
library_d3.js - increased code coverage and added an entirely new web testing framework to Empirical
- generally cleaned up the code and increased readability
There are still more modules to wrap and other things in the D3-wrapper to expand upon, which Oliver and I outlined in this GitHub issue. Feel free to contribute! We would all appreciate it so much!
🔗 Wrapping Axis.h
The D3-wrapper team took on the selection, transition, and dataset modules all together, but Oliver and I each re-wrapped another module as well. I took on Axis! The major changes I’ve made from the old wrapper include:
- Added a padding parameter to the default constructor so that a value other than 60px can be specified (padding depends on the type of axis; e.g. for axisLeft, there is only padding between the axis line and the left side of the svg)
- Added a constructor with shift_x and shift_y parameters in order to set the initial location of an axis exactly
- Modified the DrawAxes() convenience function to take both axes’ padding into account if specified; otherwise the padding is 60px
- Added a version of SetTicks() that takes both the number of ticks and the tick format to reflect common usage of the D3.js .ticks() method
- Wrote three versions of Rescale(), each one taking a different input type, since SetDomain() can take three different types of arguments for the min and max of the new domain
- Created axis.cc, a comprehensive testing file for axes and related their methods
- Added emp_asserts to methods that should not be called before Draw() for debugging since the changes would be overwritten
- Updated variable names and EM_ASM macros, and generally kept to best practices
Here are some interesting parts of the code:
🔗 Saving space with a ternary
I love the convenience and conciseness of the Javascript ternary operator.
In the default Axis constructor, I spotted a place where it could really squish down some conditional code:
choosing whether to create an axisBottom, axisTop, axisLeft, or axisRight based on the type argument.
The ternary really paid off in this case!
Notice the
EM_ASMmacro in the example below—that’s an Emscripten tool that we use to execute chunks of JavaScript inline with our C++ code. Find out more here.
Here’s what the old version looked like:
if (type == "left") {
  EM_ASM_ARGS({
    js.objects[$0] = d3.axisLeft(js.objects[$1]);
  }, this->id, scale.GetID());
} else if (type == "right") {
  EM_ASM_ARGS({
    js.objects[$0] = d3.axisRight(js.objects[$1]);
  }, this->id, scale.GetID());
} else if (type == "bottom") {
  EM_ASM_ARGS({
    js.objects[$0] = d3.axisBottom(js.objects[$1]);
  }, this->id, scale.GetID());
} else if (type == "top") {
  EM_ASM_ARGS({
    js.objects[$0] = d3.axisTop(js.objects[$1]);
  }, this->id, scale.GetID());
} else {
  std::cout << "WARNING: Invalid type given to axis constructor" << std::endl;
  EM_ASM_ARGS({
    js.objects[$0] = d3.axisBottom(js.objects[$1]);
  }, this->id, scale.GetID());
}
And here’s the new version using the ternary operator:
EM_ASM({
  const id = $0;
  const scale = emp_d3.objects[$1];
  const type = UTF8ToString($2);
  emp_d3.objects[id] = (type == "left") ? (d3.axisLeft(scale))
                      : (type == "right") ? (d3.axisRight(scale))
                      : (type == "top") ? (d3.axisTop(scale))
                      : (d3.axisBottom(scale));
}, this->id, scale.GetID(), type.c_str());
In order to use the ternary—a JavaScript operator—I wrapped the entire chunk in one EM_ASM macro
and then passed type into it from the C++ side.
This section of code is also a good example of how we increased the wrapper code’s readability:
in the new version, when we jump into an EM_ASM to execute inline JavaScript,
we assign variable names to all of the arguments we’re passing in first thing.
That way we can refer to the object’s ID as id instead of $0 in the code.
🔗 Drawing axisLeft labels
When you call .Draw() on an axisLeft with a label, you expect the label to be positioned
on the left side of the axis, rotated so that when you read it from left to right you’re really
reading from the bottom of the axis to the top.
Originally, this code seemed to do the trick:
EM_ASM_ARGS({
  var axis_range = js.objects[$0].scale().range();  // get the range of the axis's scale
  var orient = UTF8ToString($3);

  if (orient == "left") {
    var dy = "-2.5em";
    var x_divisor = -2.0;
    var text_orient = -90;
  }
  // calculate the label's x-coordinate so that it's centered on the axis
  var label_x = axis_range[0]+(axis_range[1]-axis_range[0])/x_divisor;
  if (axis_range[0] > axis_range[1]) {
    label_x = axis_range[1]+(axis_range[0]-axis_range[1])/x_divisor;
  }

  js.objects[$1].append("text")                                // add a text element
                .attr("transform", "rotate("+text_orient+")")  // rotate it -90
                .attr("x", label_x)                            // set its x-coordinate
                .attr("dy", dy)                                // set its distance from the axis
                .style("text-anchor", "middle")                // center its text
                .text(UTF8ToString($2));                       // set its text content
}, this->id, group.GetID(), label.c_str(), orientation.c_str());
(I simplified the code above and added comments to highlight what happens to axisLeft labels.)
A scale’s domain is the lower and upper limits of the data that will be graphed on it, and its range is the lower and upper limits of the space it will cover—in other words, the pixels it will be drawn on.
However, a giant bug lurked under the surface, unseen until I tried to create an axisLeft
on a scale with a range of (50, 350) and my tests failed. It turns out that the method above
only works if the lower limit of the range is 0.
Otherwise, the label positioning is way off—usually lost somewhere outside of the bounds
of the SVG you’re drawing on.
To fix this bug, I had to switch the signs of both the lower and upper limits of the range
before drawing the label:
EM_ASM({
  const id = $0;
  const g = $1;
  const label_str = UTF8ToString($2);
  const orient = UTF8ToString($3);

  // get the lower and upper limits of the range on the axis's scale
  var axis_range_low = d3.min(emp_d3.objects[id].scale().range());
  var axis_range_high = d3.max(emp_d3.objects[id].scale().range());

  if (orient == "left") {
    axis_range_low *= -1;  // since left axis label is rotated -90,
    axis_range_high *= -1; // range values must be given opposite sign
    var dy = "-2.5em";
    var text_orient = -90;
  }
  // calculate the label's x-coordinate so that it's centered on the axis
  var label_x = axis_range_low + (axis_range_high - axis_range_low) / 2;

  emp_d3.objects[g].append("text")                                // add a text element
                   .attr("x", 0).attr("y", 0)                     // set its initial location to (0,0)
                   .attr("transform", "rotate("+text_orient+")")  // rotate it -90
                   .attr("x", label_x)                            // set its x-coordinate
                   .attr("dy", dy)                                // set its distance from the axis
                   .style("text-anchor", "middle")                // center its text
                   .text(label_str);                              // set its text content

}, this->id, group.GetID(), label.c_str(), orientation.c_str());
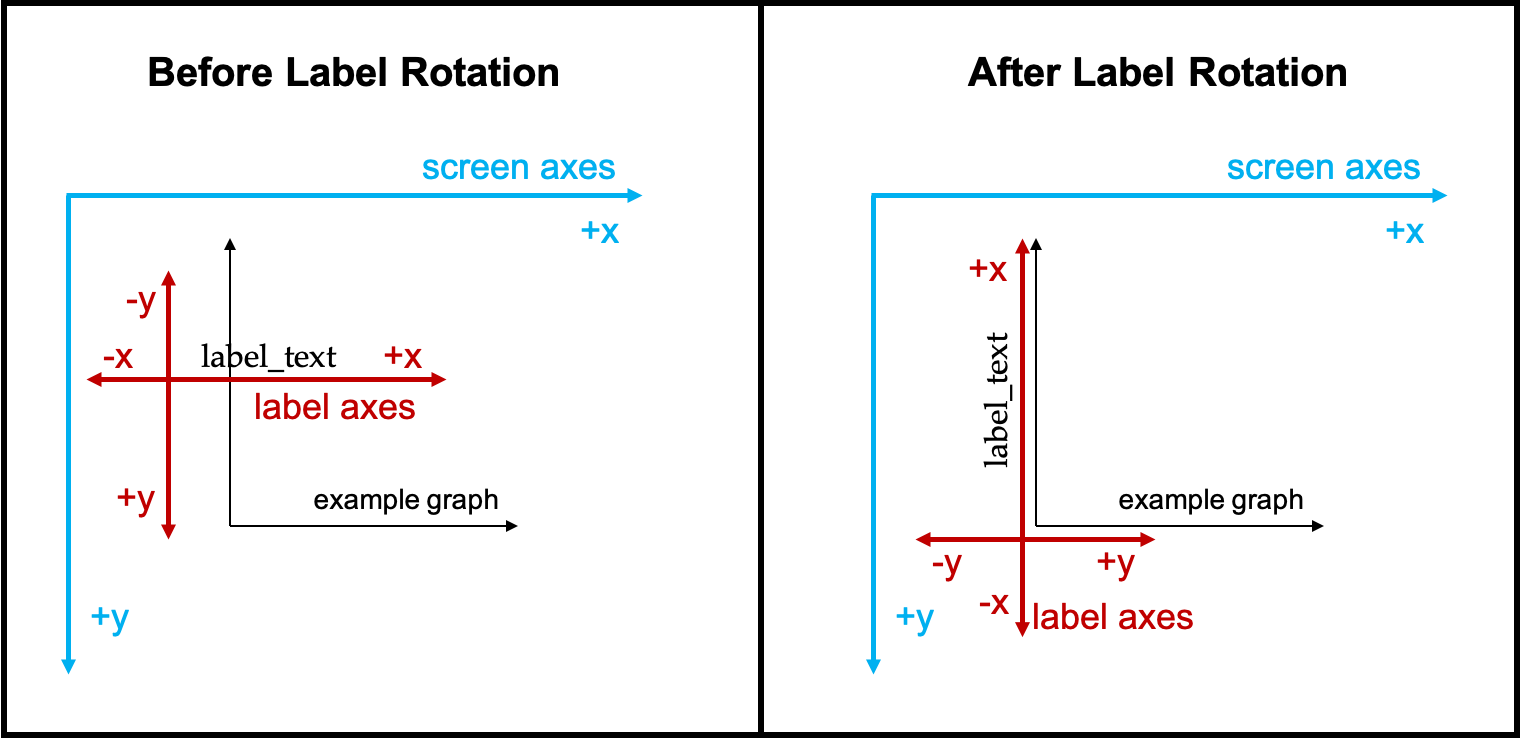
Why? Because of how that rotate(-90) is interpreted.
The range on a vertical axis such as axisLeft specifies an area along the screen’s y-axis to draw on.
In terms of the screen’s y-axis, a bigger positive number corresponds with a spot lower down on the screen.
However, when the label is rotated, its axes go with it; its new y-axis is parallel to the screen’s x-axis,
and its new x-axis is parallel to the screen’s y-axis.
That’s why we set the label’s x-coordinate to move it up or down on the screen.
But giving it a bigger positive number for its x-coordinate corresponds with a spot higher up on the screen, not lower down—and that’s the opposite of where we want it to go based on its range.
We have to switch the signs of the range limits in order to make the range’s positive y-axis shift translate into a negative x-axis shift for the label after rotation.
But why did it work when the lower limit of the range was 0 before? Because the old version:
axis_range_low + (axis_range_high - axis_range_low) / -2
had the same effect as:
axis_range_low + (-axis_range_high + axis_range_low) / 2
The code was effectively switching the sign of the upper limit of the range. And, since 0 doesn’t have a sign, the label ended up in the right place.
🔗 A Big Ol’ Bug
Unfortunately, Oliver and I discovered a Big Ol’ Bug![]() during the testing phase (with Dr. Emily Dolson’s Karma/Mocha/Chai system and Alex Lalejini’s new test-running framework). In a nutshell, the D3-wrapper currently cannot be incorporated with the rest of Empirical’s web tools.
during the testing phase (with Dr. Emily Dolson’s Karma/Mocha/Chai system and Alex Lalejini’s new test-running framework). In a nutshell, the D3-wrapper currently cannot be incorporated with the rest of Empirical’s web tools.
When you create an Empirical Document object, it needs to know exactly what it encompasses, because it redraws itself from time to time. Unfortunately, Documents currently have no way of knowing when you add a D3 object onto them, so all of the D3 disappears when they redraw. You can have D3 and Empirical web tools on the same web page, as long as they’re in completely separate containers. We will document this issue well in our hand-off notes!
🔗 How to Make a Visualization with the Wrapper
Tip: Build something in regular D3.js first before jumping into the wrapper!
An easy way to start a project that’s built on Empirical is by using the cookiecutter! In terms of coding with the D3-wrapper after that, here are some quick tips:
-
Know what you want. Try drawing out the visualization you’re imagining before sitting down to code.
-
Look at some examples. It might be helpful to get a feel for the structure of a visualization—or just see how constructing an object works—by looking at one of the testing or pre-built visualization files. For example,
Empirical/tests/web/d3/axis.ccis the testing file for Axis, and in it I construct several selections, scales, and axes, as well as modify the axes with almost all of the available functions. The code should work since the tests are passing right now!
-
Start with absolute basics. First, make a selection. Check that it works. Then, make a scale. Check that it works. Then, apply that scale to an axis. And so on. To test that something works, I suggest compiling your C++ file into JS with Emscripten, and creating a simple HTML file that uses
<script src="{JS filepath}"></script>to import it. Then start a server, point your browser to it, and inspect the DOM through developer tools to see what’s there. -
Play around. Maybe you didn’t know what you wanted after all! You can always modify the objects you construct; for example, after you create an Axis object, you can use functions like
Move(),SetTicks(), andAdjustLabelOffset()to customize it further. Try changing things around a bit, adding color, and making your visualization as clear and exciting as possible.
🔗 A Scatterplot
As a final project after working on the D3-wrapper for the summer, I decided to create a scatterplot visualization demo using the D3-wrapper. That way, someone who isn’t very familiar with D3.js could have an example to jump of off for their own web app visualization. Check it out here!
Here’s a basic scatterplot that my demo features:
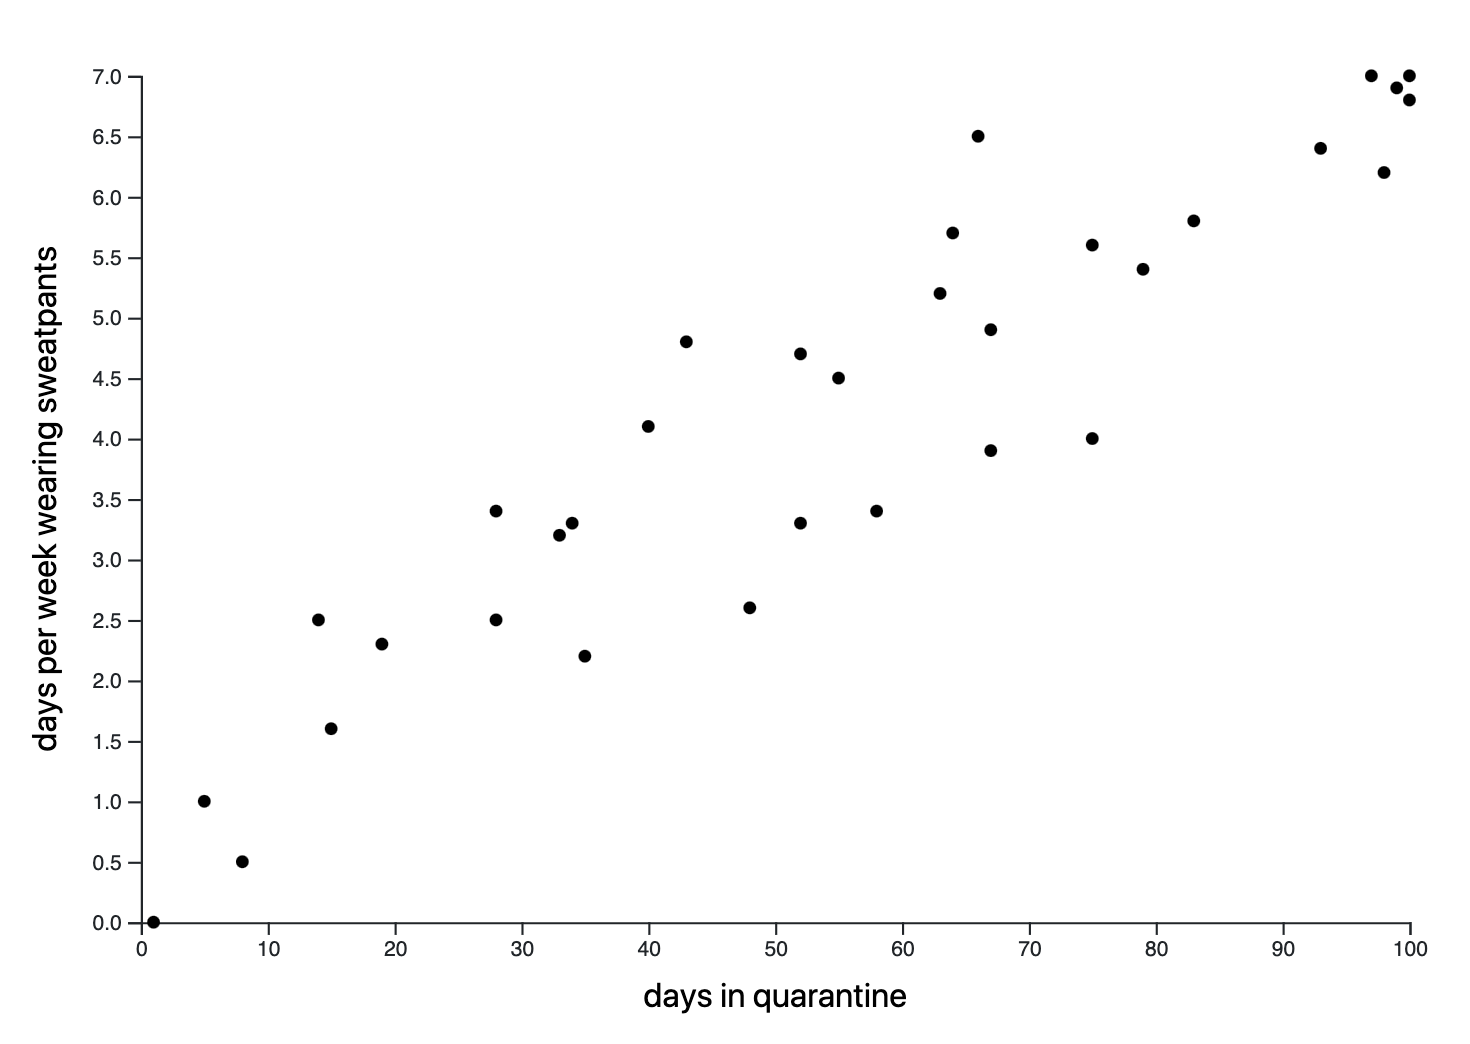
The demo includes a couple different examples of scatterplots you can generate with the D3-wrapper, and lists the steps I took to create them as well as the raw code.
Also check out Oliver’s awesome Bar Chart sorting algorithm visualization!
🔗 Thank you!
I am so thankful to have been a part of the 2020 WAVES team! Thank you to Dr. Charles Ofria and Matthew Andres Moreno for organizing such an educational and well-thought-out workshop. My summer was looking bleak, but WAVES turned that upside down; I got to code and learn alongside so many incredible collaborators and mentors. Every single person I met (be it virtually) was welcoming. It was a fantastic experience!
I especially want to thank the other three members of the D3-wrapper team: Oliver Baldwin Edwards, and my two wonderful mentors, Dr. Emily Dolson and Alex Lalejini. We definitely made WAVES together!
This work is supported through Active LENS: Learning Evolution and the Nature of Science using Evolution in Action (NSF IUSE #1432563). Any opinions, findings, and conclusions or recommendations expressed in this material are those of the author(s) and do not necessarily reflect the views of the National Science Foundation.
🔗 Check out these wonderful people:
 Oliver Baldwin Edwards (collaborator), a senior at Amherst College studying Computer Science and Statistics. We worked on this wrapper project together, and he’s an amazing programmer!
Github | Twitter
 Dr. Emily Dolson (mentor), an Assistant Professor in Computer Science at Michigan State University starting this fall with formal training in Computer Science, Evolutionary Biology, and Ecology. She creates mind-blowing web apps and visualizations for her research!
Github | Twitter | Website
 Alex Lalejini (mentor), a fifth year PhD student working with Dr. Charles Ofria in Computer Science and Ecology, Evolutionary Biology, & Behavior at Michigan State University. He is a super welcoming researcher and a brilliant coder!
Github | Twitter | Website
🔗 Other resources to peruse:
- My wrapped d3 scatterplot visualization demo!
- Empirical library repo, docs, cookiecutter, and example gallery
- Empirical’s Web Tools docs
- Emscripten docs (compiles C and C++ into JavaScript to run on the web)
- D3.js docs and Graph Gallery
- A tool to help you preview D3 formatting specifiers (I referenced it for formatting axis ticks)
- Javascript Testing on Travis CI with Karma and Mocha (by Emily Dolson) - this is how our web testing is set up!
- NYTime’s svg crowbar, which allows you to extract svg elements with their styling, meaning you can download the D3.js visualizations you create!
-
The Curiously Recurring Template Pattern (CRTP) - this is used in our wrapper’s
selection.h! - Salmon Run, a fun game—or is it an evolutionary playground?
- If you’d like to take a look at some of my other projects, please click here to go to my GitHub!