Visualizing Sorting Algorithms with the new D3-wrapper
🔗 Writing D3.js code in C++
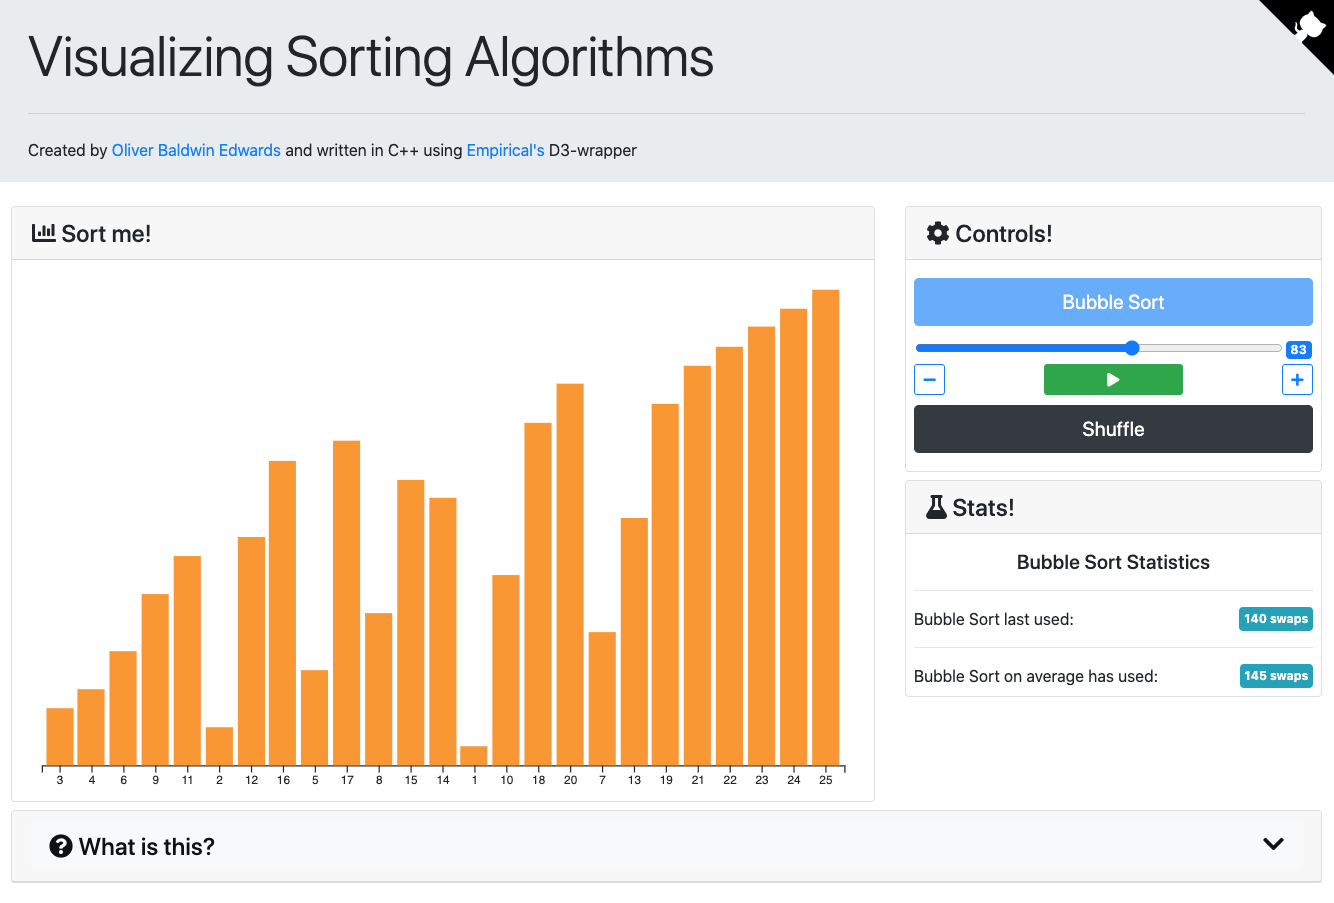
The above visualization was written entirely in C++ using Empirical! (You can find the live version here)
Empirical’s web tools allow developers to easily design a web page using C++ (and the Emscripten compiler). This allows research code written in C++ to be visualized on the web without having to port the code into JavaScript (and who wants to write research code in JavaScript?). Plus, using the Emscripten compiler means that the JavaScript code produced runs extremely fast.
This summer I was a WAVES participant and helped to revamp Empirical’s support for web visualizations for use in the next version of Avida-ED.
Specifically, this meant replacing the old Empirical D3-wrapper (built on D3 version 3) with one that supports the newest version of D3 (version 5). I tackled this project with the wonderful Elizabeth Carney, Alex Lalejini, and Emily Dolson.
🔗 What is D3?
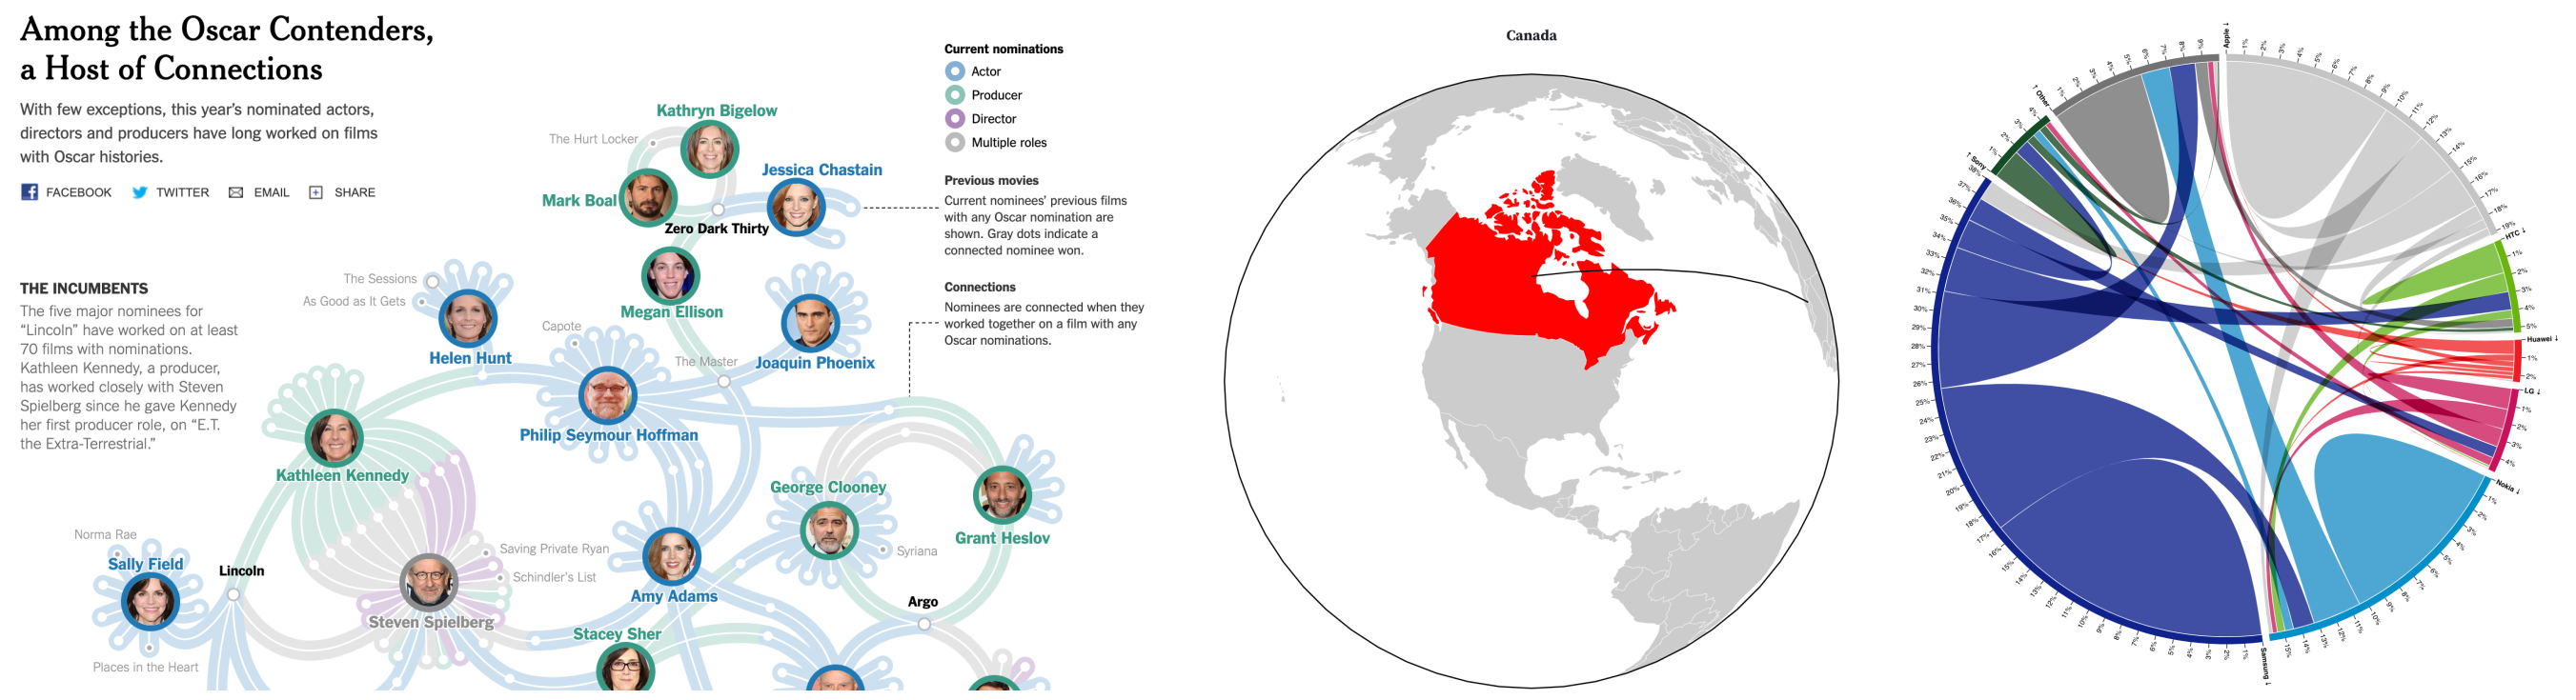
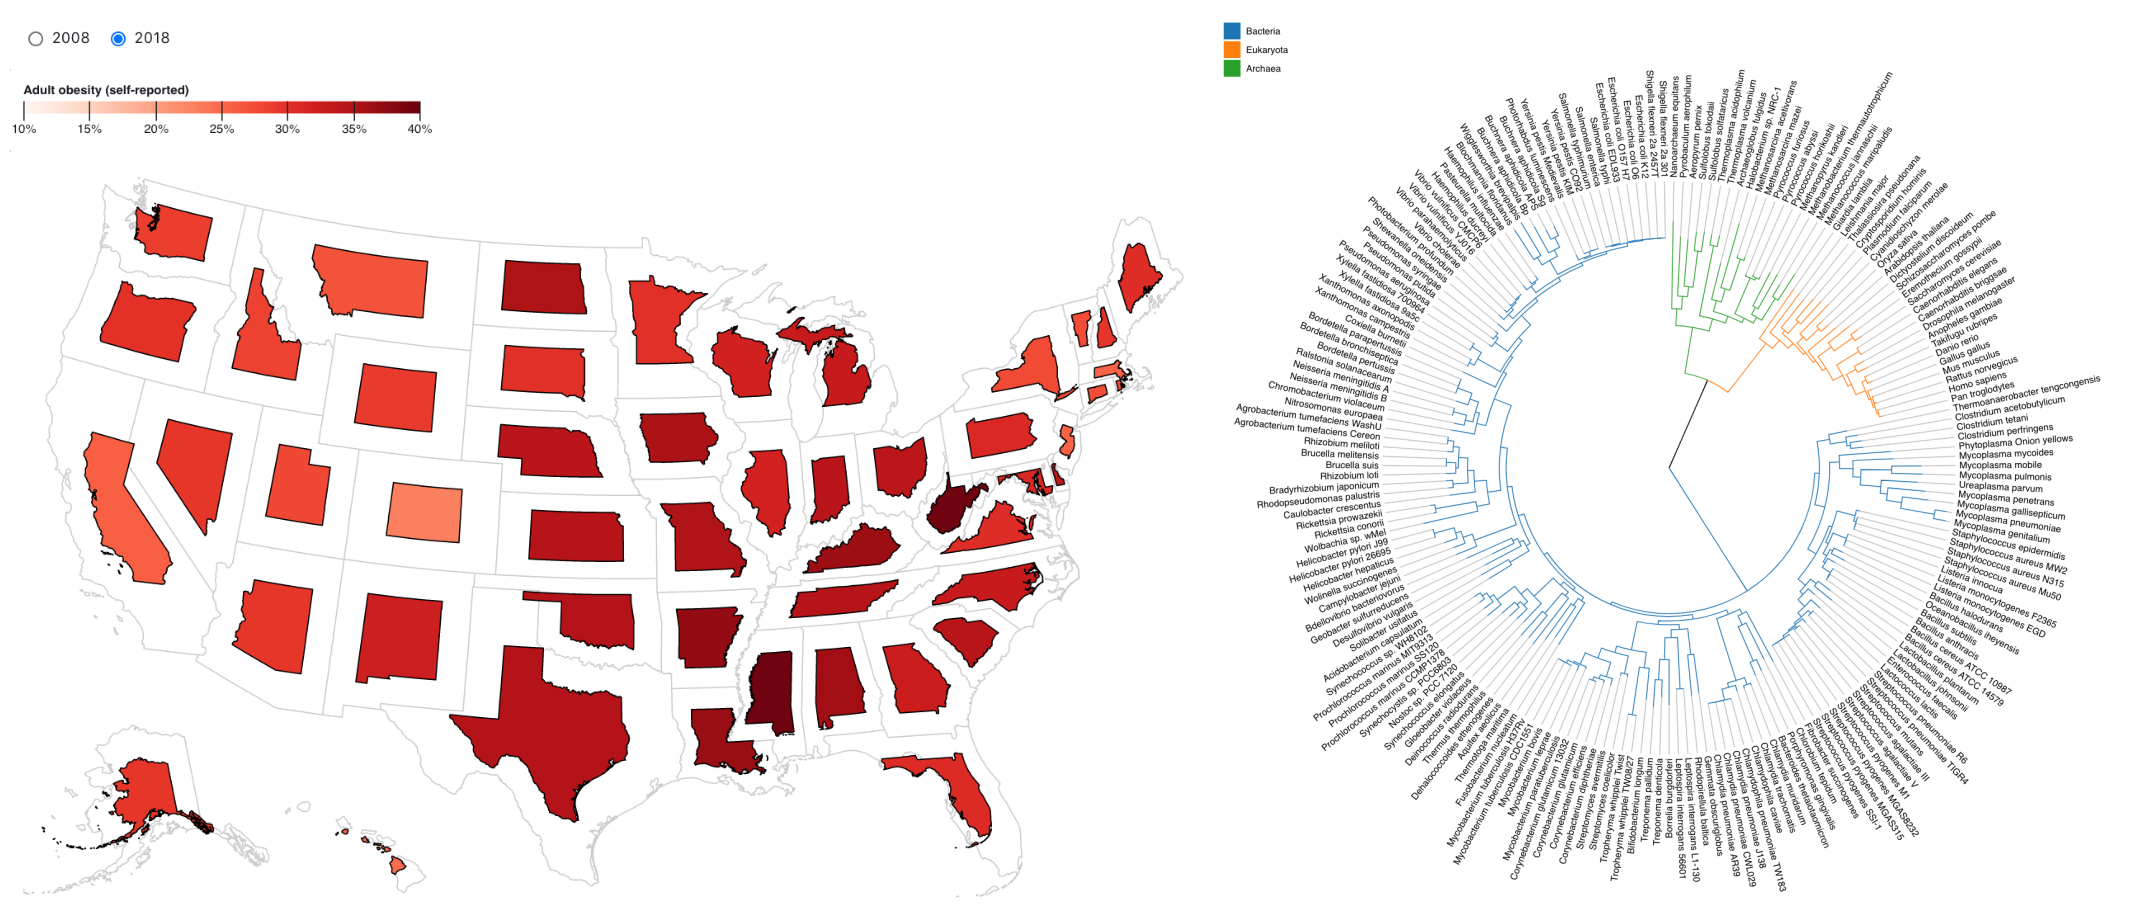
D3 (Data-Driven Documents) is a JavaScript library that allows for all sorts of custom-made, interactive visualizations. Some cool examples include:
- An interactive graph highlighting the connections between Oscar contenders in 2013
- An animation of the world globe
- A chord diagram of consumer’s smartphone brand loyalty
- An interactive cartogram displaying obesity in the US
- A phylogeny tree
Although it has a steep learning curve, D3 provides complete control over all aspects of a visualization, leading to all sorts of creative, interactive creations.
🔗 How does the wrapper work?
The D3-wrapper works by taking advantage of Emscripten and Empirical’s web tools to expose D3.js functionality through C++. We created a custom JavaScript library (which is accessible through an Emscripten compiler tag) that—among other things—holds a reference to different D3 objects (such as a selection or scale).
When called upon to create a D3 object, the C++ wrapper hops into JavaScript, accesses the proper D3 object (each object has a unique ID), and calls the desired D3.js function on that object. While this workflow is concise for many D3 functions, the challenges of creating this wrapper included the messiness of having to constantly jump between C++ and JavaScript.
For example, the d3.scaleTime function takes JavaScript Date objects as an input.
But since there’s no notion of a Date object on the C++ side, I had to create a custom Date struct that mimicked a JavaScript Date.
I also had to deal with the unpleasantness of passing a C++ Date into JavaScript (which meant manually passing in each of the Date member variables into JavaScript, and then recreating the Date using JavaScript’s Date constructor).
For reference, the
Datestruct that I created looks like this:struct Date { int year; int month; int day; int hours; int minutes; int seconds; int milliseconds; Date() { ; } // note that month should be passed in 0-indexed to keep consistent with JavaScript (0 = January) Date(int year, int month, int day = 1, int hours = 0, int minutes = 0, int seconds = 0, int milliseconds = 0) { this->year = year; this->month = month; this->day = day; this->hours = hours; this->minutes = minutes; this->seconds = seconds; this->milliseconds = milliseconds; } std::string ToString() { return std::to_string(this->year) + " " + std::to_string(this->month) + " " + std::to_string(this->day) + " " + std::to_string(this->hours) + ":" + std::to_string(this->minutes) + ":" + std::to_string(this->seconds) + ":" + std::to_string(this->milliseconds); } };
The goal of the D3-wrapper is to do all of this messy C++/Javascript work behind the scenes so that users can focus on making awesome visualizations!
🔗 Wrapping scales.h
As a team, Elizabeth, Alex, Emily, and I wrapped the selection, transition, and dataset modules during remote pair programming sessions.
Individually, Elizabeth and I each wrapped our own modules.
I worked on the scales.h file, which wraps almost the entirety of the d3-scales module.
Specifically, the major things that I added were the following:
- An entirely new organizational layout that groups scales by their input and output types (allows for more concise and robust code)
- Support for all 25 D3 version 5 scales
- Support for almost all helper functions for each of the 25 scales
- Support for
Dateobjects (specifically to be used withd3.scaleTime) - A comprehensive set of web tests (for details see the file here)
- Support for passing maps from C++ to JavaScript: I added two
emp::pass_map_to_javascriptfunctions in js_utils.h as well as appropriate tests (see more about this in thisweb-code-demo.ccfile)
We were able to test the wrapper using Emily’s Karma/Mocha/Chai system and Alex’s TestRunner (which deals with the complexity of JavaScript code running out of sync with C++ code during testing).
This testing framework is now being adopted as the web testing framework across Empirical.
🔗 Writing web code with Empirical and Emscripten
While creating the D3-wrapper, we relied heavily on writing JavaScript code from C++. We were able to do so by using both Emscripten’s built-in functionality (which covers basic features) and Empirical’s web tools (which deal with more advanced features).
The Emscripten compiler gives you access to C++ functions that can be used to hop into JavaScript and return values to C++.
For example, the following EM_ASM_INT({}) function will return the integer value 22 from JavaScript and save it to the cpp_x variable in C++:
int cpp_x = EM_ASM_INT({
                const js_x = 11 * 2;
                return js_x;
            });
While Emscripten allows you to return integers and doubles (as well as write raw JavaScript without returning anything), it does not allow you to easily return more complicated data types such as strings and arrays. Empirical’s web tools cover these holes and allow you to pass more complicated data types back and forth from C++ to JavaScript.
For a list of things that are possible with Emscripten and Empirical, see this attached web-code-demo.cc file.
🔗 How to use the D3-wrapper
As a way to show off the new D3-wrapper, I decided to create an Empirical web app that visualized how different sorting algorithms work. A screenshot of the web app is at the top of this post, but the link to the full one is here.
Below I’m going to explain the steps I took to create my web app in an effort to help those new to the wrapper get started with making their own visualizations.
🔗 Resources for getting started with D3
Even when pre-packaged visualizations are built into the D3-wrapper, the best way to have complete control is to start learning D3 (since the D3-wrapper attempts to mimic the syntax of D3.js). While I won’t go in to any details here, below is a list of the most helpful resources I used to learn D3:
- A useful, brief intro written by the creator of D3
-
A multi-step tutorial that walks you through everything D3 from the ground up
- Although slightly outdated, it’s a great tutorial that provides useful motivation behind confusing steps that many others leave out
- An in depth guide to D3 that dives into some of the finer D3 details and explains concepts with easy-to-understand examples
-
A gallery of D3 viualizations that provides the step-by-step code needed to recreate each one
- I used this site religiously over the summer and it’s a fantastic resource
- There’s also a good intro to D3 hidden away here
🔗 Getting set up
Getting set up with an Empirical project can be tricky at first, but luckily there are some great resources to make this as easy as possible.
I used this cookiecutter outline to build my project on top of Empirical. If you don’t want all of the extra bells and whistles that come along with the cookiecutter outline, you can follow this tutorial that gets you set up with all the basics needed to write Empirical web code.
🔗 Visualizing!!
It’s finally time to use the D3-wrapper and create a visualization!
First, lets explore how I created the sortable bar chart. I laid out all of my code inside of a struct, and started by declaring the necessary member variables:
struct BarPlot {
  ///////////////////////////////
  //     MEMBER VARIABLES      //
  ///////////////////////////////
  // barplot layout vars
  emp::map<std::string, int> margin = {{"top", 25}, {"right", 25}, {"bottom", 25}, {"left", 25}};
  int width = 0;
  int height = 0;
  std::string barColor = "#fc9723";
  int transitionDuration = 750;

  // D3 selections / scales / axis
  D3::Selection svg;
  D3::Selection barplot;
  D3::Selection bars;
  D3::Selection xAxisSel;
  D3::BandScale xScale;
  D3::LinearScale yScale;
  D3::Axis<D3::BandScale> xAxis;

  // data and functions for data values
  emp::array<int, 25> data;
  std::function<int(int, int, int)> return_d =
      [](int d, int i, int j) { return d; };

  // ...
}
I decided to represent the bars I was sorting in an array of length 25 named data, where the values 1 through 25 would be held. I initialized data in the constructor of the struct:
BarPlot() {
    // init data and shuffle it
    for (int i = 0; i < data.size(); i++) {
      data[i] = i + 1;
    }
    ShuffleArray(data);
}
Once all of this is setup, it’s time to do the heavy lifting, which happens inside of the Init() function:
void Init() {
    // init height and width (based on parent div width)
    width = 725;
    height = 450;

    // initialize svg object with proper dimensions
    svg = D3::Select("#emp_d3_wrapper")
              .Append("svg")
              .SetAttr("viewBox", "0 0 " + std::to_string(width)+ " " + std::to_string(height));

    // create group to hold all barplot elements
    barplot = svg.Append("g")
                  .SetAttr("id", "barplot");

    // initialize scales
    xScale.SetDomain(data)
          .SetRange(margin["left"], width - margin["right"]);
    // note that this can't be chained above (need to use a curiously recurring template pattern in scales.h to fix this)
    xScale.SetPadding(0.15);

    yScale.SetDomain(0, data.size())
          .SetRange(height - margin["bottom"], margin["top"]);

    // initialize and draw x axis
    xAxisSel = barplot.Append("g")
                      .SetAttr("id", "x-axis")
                      .Move(0, height - margin["bottom"]);

    xAxis = D3::Axis<D3::BandScale>("bottom", "", 0)
              .SetScale(xScale)
              .Draw(xAxisSel);

    // initialize and draw bars
    bars = barplot.Append("g")
                  .SetAttr("id", "bars");

    bars.SelectAll("rect")
        .Data(data, return_d)
        .EnterAppend("rect")
        .SetAttr("x", [this](int d, int i, int j) { return xScale.ApplyScale<int, int>(d); })
        .SetAttr("width", xScale.GetBandwidth())
        // initialize the y value and height to zero to create a transition on page load
        .SetAttr("y", [this](int d, int i, int j) { return yScale.ApplyScale<int, int>(0); })
        .SetAttr("height", 0)
        .MakeTransition().SetDuration(1750)
        .SetAttr("y", [this](int d, int i, int j) { return yScale.ApplyScale<int, int>(d); })
        .SetAttr("height", [this](int d, int i, int j) { return height - margin["top"] - yScale.ApplyScale<int, int>(d); })
        .SetAttr("fill", barColor);
  }
Note that the
svggets added to theemp_d3_wrapperdiv, which has already been created in myindex.htmlfile:<div id="emp_d3_wrapper"></div>
And now all we have to do to draw the initial bar plot is call Init() from main():
BarPlot barChart{};

int main() {
  barChart.Init();
}
🔗 How does the data update?
While I won’t go in to detail on how the play button and slider work, I’ll explain the core functionality as to how updating the data array will update the bar chart itself.
Getting the play button to work was quite tricky due to how hard it is to do JavaScript timeouts from C++. If you’re not careful, C++ code will always run before the JavaScript code due to JavaScript’s asynchronous nature. In short, I had to create a custom JavaScript event that triggers itself if the data hasn’t been fully sorted yet.
To update my visualization, I created a function called UpdateViz() which takes an array of 25 integers as its only argument. This function is called whenever the Bubble Sort slider or Shuffle Array button are changed/clicked. When these buttons are activated, the underlying data array is changed, and passed into UpdateViz():
/// An update function that should be called when the data is changed (sorted or shuffled)
void UpdateViz(emp::array<int, 25> newData) {
    // if the play button is currently active, make the transition faster
    if(isPlaying) {
        transitionDuration = 50;
    }
    else {
        transitionDuration = 750;
    }

    // if the data is fully sorted, change barColor
    if(bs_slider.GetCurrValue() == bs_slider.GetMax()) { barColor = "#69b3a2"; }
    else { barColor = "#fc9723"; }

    // update the scales and axes
    xScale.SetDomain(newData);
    xAxis.Rescale(newData, xAxisSel);

    // update the bars
    bars.SelectAll("rect")
        .Data(newData, return_d)
        .MakeTransition().SetDuration(transitionDuration)
        .SetAttr("x", [this](int d, int i, int j) { return xScale.ApplyScale<int, int>(d); })
        .SetAttr("y", [this](int d, int i, int j) { return yScale.ApplyScale<int, int>(d); })
        .SetAttr("height", [this](int d, int i, int j) { return height - margin["top"] - yScale.ApplyScale<int, int>(d); })
        .SetAttr("fill", barColor);
}
Here, the xScale and xAxis must first be changed to display the change in the order of the data. Once this happens, we can update the actual bars themselves based on their new values (as well as apply a transition to show the change in position/height of each bar).
To see the full code, check out my GitHub repo.
For more information on using the D3-wrapper be sure to check out Elizabeth’s blog post as well as her live demo!
🔗 Next steps
Part of our goal for this summer was to create stand alone visualizations that users without D3 knowledge could use. While we ultimately ran out of time to do so (D3 is huge), we hope that my and Elizabeth’s web apps will provide a good foundation for the next person to pick up the project.
In short, the wrapper needs:
- More wrapped modules!
- Better test coverage for selections, transitions, and dataset
- Prepackaged visualizations for those with no D3 knowledge
For a more comprehensive and detailed list see this GitHub issue.
🔗 Thank You!
I’m so grateful to have been a WAVES participant this summer! It was an incredible experience and I’ve learned a tremendous amount over such a short 10 weeks (I came in with no prior C++ and minimal web development knowledge). Everyone I interacted with was extremely welcoming and willing to help explain difficult C++ concepts and/or debug messy code.
I want to give a special shoutout to Elizabeth Carney, Alex Lalejini, and Emily Dolson who are all incredible people and amazing to work with! Without them, none of this would have been possible.
This work is supported through Active LENS: Learning Evolution and the Nature of Science using Evolution in Action (NSF IUSE #1432563). Any opinions, findings, and conclusions or recommendations expressed in this material are those of the author(s) and do not necessarily reflect the views of the National Science Foundation.