Gallery
Example outset plots, with source code.
Contributions welcome! Open an issue or a pull request.
Table of Contents
Setup
[1]:
import copy
import itertools as it
import typing


import cartopy.crs as ccrs
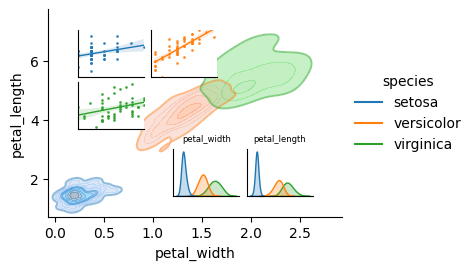
from datetime import datetime, timedelta
from matplotlib import cbook as mpl_cbook
from matplotlib import cm as mpl_cm
from matplotlib import colors as mpl_colors
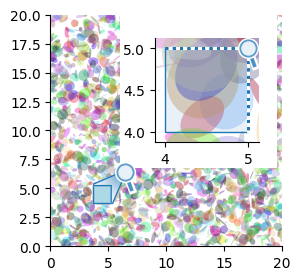
from matplotlib import patches as mpl_patches
from matplotlib import text as mpl_text
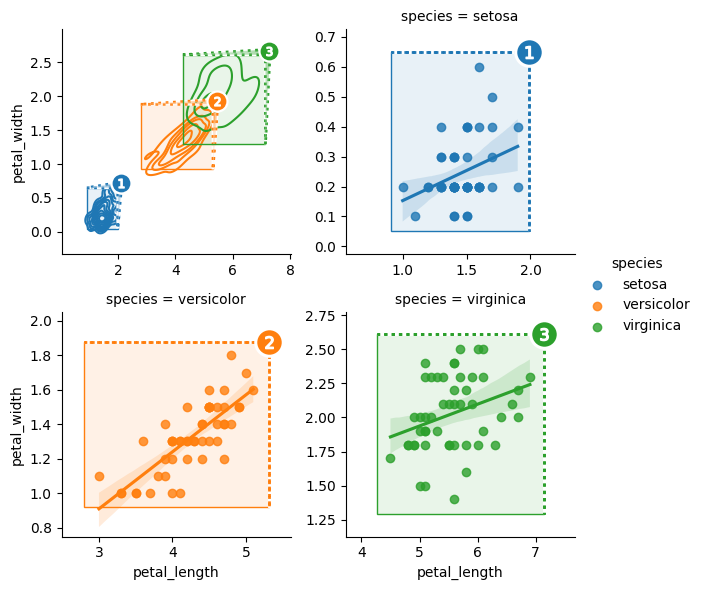
import matplotlib as mpl
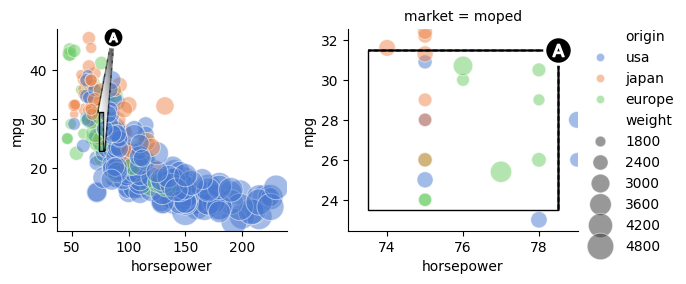
from matplotlib import pyplot as plt
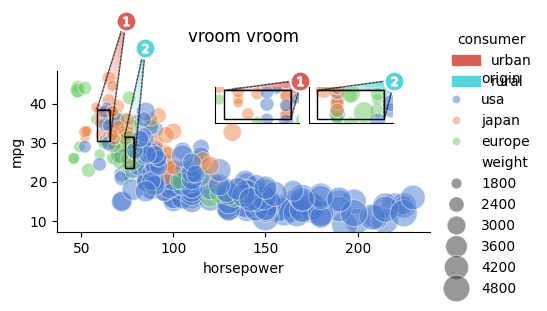
import numpy as np
import opytional as opyt
import pandas as pd
import seaborn as sns

import outset as otst
from outset import mark as otst_mark
from outset import patched as otst_patched
from outset import tweak as otst_tweak
from outset import util as otst_util
from outset import stub as otst_stub
cartopy
[2]:
# WMTS service URL and layer
wmts_url = "https://map1c.vis.earthdata.nasa.gov/wmts-geo/wmts.cgi"
wmts_layer = "VIIRS_CityLights_2012"

# initialize outset grid with named frames and marqueeplot configuration
outset_grid = otst.OutsetGrid(
    otst_util.NamedFrames(
        pasta=(12, 40, 16, 42),  # (x0, y0, x1, y1)
        croissant=(1, 48, 3, 50),
    ),
    col="dish",
    marqueeplot_kws={"leader_face_kws": {"alpha": 0}},
    palette=sns.color_palette("husl", 2),
    subplot_kws={"projection": ccrs.PlateCarree()},  # for underlying FacetGrid
)


# function to plot WMTS layer on axis
def draw_map(ax):
    ax.add_wmts(wmts_url, wmts_layer)
    ax.set_extent([-15, 25, 35, 60], crs=ccrs.PlateCarree())


# apply plot function to all subplots
outset_grid.broadcast(draw_map)

# apply marquee elements
outset_grid.marqueeplot()

pass  # sponge up last return value, if any
/opt/hostedtoolcache/Python/3.10.13/x64/lib/python3.10/site-packages/owslib/wmts.py:645: RuntimeWarning: TileMatrixLimits with tileMatrix "1" already exists
  warnings.warn(msg, RuntimeWarning)
/opt/hostedtoolcache/Python/3.10.13/x64/lib/python3.10/site-packages/owslib/wmts.py:645: RuntimeWarning: TileMatrixLimits with tileMatrix "2" already exists
  warnings.warn(msg, RuntimeWarning)
/opt/hostedtoolcache/Python/3.10.13/x64/lib/python3.10/site-packages/owslib/wmts.py:645: RuntimeWarning: TileMatrixLimits with tileMatrix "3" already exists
  warnings.warn(msg, RuntimeWarning)
/opt/hostedtoolcache/Python/3.10.13/x64/lib/python3.10/site-packages/owslib/wmts.py:645: RuntimeWarning: TileMatrixLimits with tileMatrix "4" already exists
  warnings.warn(msg, RuntimeWarning)
/opt/hostedtoolcache/Python/3.10.13/x64/lib/python3.10/site-packages/owslib/wmts.py:645: RuntimeWarning: TileMatrixLimits with tileMatrix "5" already exists
  warnings.warn(msg, RuntimeWarning)
/opt/hostedtoolcache/Python/3.10.13/x64/lib/python3.10/site-packages/owslib/wmts.py:645: RuntimeWarning: TileMatrixLimits with tileMatrix "6" already exists
  warnings.warn(msg, RuntimeWarning)

heatmap
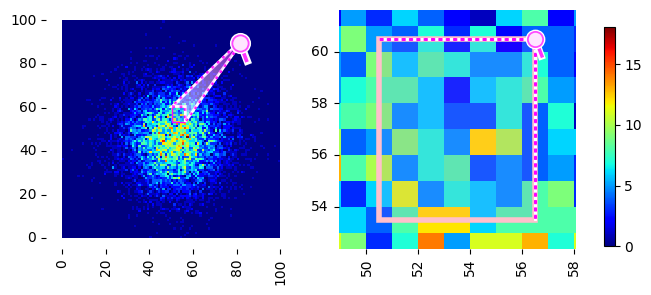
[3]:
# generate random data and assign to x, y
data = np.random.randn(10000, 2)
x, y = data.T

# create a 2D histogram from data
heatmap, _xedges, _yedges = np.histogram2d(x, y, bins=(100, 100))

# initialize outset grid with outset frame coords configuration for marquee plot
outset_grid = otst.OutsetGrid(
    [(50.5, 53.5, 56.5, 60.5)],  # (x0, y0, x1, y1) region to outset
    color="fuchsia",
    marqueeplot_outset_kws={"frame_edge_kws": {"lw": 4, "ec": "pink"}},
    marqueeplot_source_kws={"leader_stretch": 1},
)

# apply heatmap across all subplots
outset_grid.broadcast(
    sns.heatmap,
    heatmap.T,
    cmap="jet",
    cbar=False,  # add colorbar manually later to prevent layout issues
    square=True,
    vmin=0,
    vmax=np.max(heatmap.flat),
    zorder=-2,
)

for ax in outset_grid.axes.flat:
    ax.invert_yaxis()  # outset implementation requires ascending y-axis

# display marquee plot
outset_grid.marqueeplot(preserve_aspect=True)  # keep square aspect

# create colorbar for the last subplot
cbar = outset_grid.figure.colorbar(
    mpl_cm.ScalarMappable(
        norm=mpl_colors.Normalize(vmin=0, vmax=np.max(heatmap.flat)),
        cmap="jet",
    ),
    ax=outset_grid.axes.flat[-1],
    location="right",
    fraction=1e-9,  # steal negligible space from last subplot
)
cbar.ax.set_position([1, 0.15, 0.2, 0.73])  # expand colorbar and move over

# refresh axes ticks
for ax in outset_grid.axes.flat:
    ax.xaxis.set_major_locator(plt.AutoLocator())
    ax.xaxis.set_major_formatter(plt.ScalarFormatter())
    ax.yaxis.set_major_locator(plt.AutoLocator())
    ax.yaxis.set_major_formatter(plt.ScalarFormatter())

pass  # sponge up last return value, if any
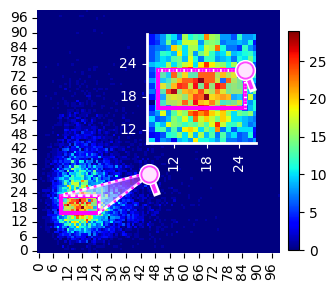
[4]:
# generate random Gumbel distributed data and assign to x, y
data = np.random.gumbel(size=(10000, 2))
x, y = data.T

# create a 2D histogram from data
heatmap, _xedges, _yedges = np.histogram2d(x, y, bins=(100, 100))

# initialize outset grid with specific configuration
outset_grid = otst.OutsetGrid(
    [(9.5, 16.5, 25.5, 23.5)],  #  # (x0, y0, x1, y1) region to outset
    color="red",
    marqueeplot_kws={
        "color": "fuchsia",
        "mark_glyph_kws": {"color": "fuchsia"},
        "frame_edge_kws": {"lw": 3},
    },
    marqueeplot_source_kws={"leader_stretch": 0.6},
)

# apply heatmap across all subplots
outset_grid.broadcast(
    sns.heatmap,
    heatmap,
    cmap="jet",
    cbar=False,  # must add colorbar manually to prevent layout issues
    square=True,
    zorder=-1,
)

for ax in outset_grid.axes.flat:
    ax.invert_yaxis()  # outset implementation requires ascending y-axis

# create colorbar for the last subplot
# must create cbar prior to insetting then position last
cbar = outset_grid.figure.colorbar(
    mpl_cm.ScalarMappable(
        norm=mpl_colors.Normalize(vmin=0, vmax=np.max(heatmap.flat)),
        cmap="jet",
    ),
    ax=outset_grid.outset_axes.flat[-1],
    location="right",
    fraction=1e-9,  # steal negligible space from last subplot
)

# insert insets and adjust outset axes
otst.inset_outsets(
    outset_grid,
    insets="NE",
    strip_ticks=False,  # override: keep ticks ofter insetting
)

# dispatch marqueeplot
outset_grid.marqueeplot(preserve_aspect=True)  # keep square aspect

# style inset axes
for ax in outset_grid.outset_axes:
    ax.tick_params(color="white", labelcolor="white")
    for spine in ax.spines.values():
        spine.set_linewidth(2)
        spine.set_edgecolor("white")
    sns.despine(ax=ax)  # remove upper/right spines

# inflate and position colorbar
cbar.ax.set_position([1, 0.15, 0.2, 0.73])  # expand colorbar and move over

pass  # sponge up last return value, if any
imshow
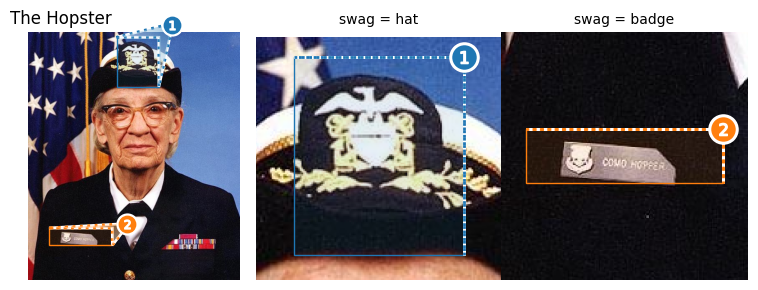
[5]:
# load sample image
with mpl_cbook.get_sample_data("grace_hopper.jpg") as image_file:
    image = plt.imread(image_file)

h, w = image.shape[0], image.shape[1]

# initialize outset grid with named frames
outset_grid = otst.OutsetGrid(
    data=otst_util.NamedFrames(
        {  # (x0, y0, x1, y1) region to outset
            "hat": (0.42 * w, 0.78 * h, 0.62 * w, 0.98 * h),
            "badge": (0.10 * w, 0.14 * h, 0.40 * w, 0.21 * h),
        }
    ),
    aspect=w / h,  # set subgrid aspect ratios to match image
    col="swag",  # names columns
    hue=True,
)

# take actions that might affect layout early
outset_grid.source_axes.set_title("The Hopster", loc="left")
outset_grid.broadcast(lambda: plt.axis("off"))
plt.tight_layout()  # refresh layout

# add content to all subplots
outset_grid.broadcast(  # display image
    plt.imshow,
    image,
    extent=(0, w, 0, h),  # ensures ascending yaxis
    origin="upper",
    zorder=-1,
)

# display marquee plot, keeping even aspect
outset_grid.marqueeplot(preserve_aspect=True)

pass  # sponge up last return value, if any
[6]:
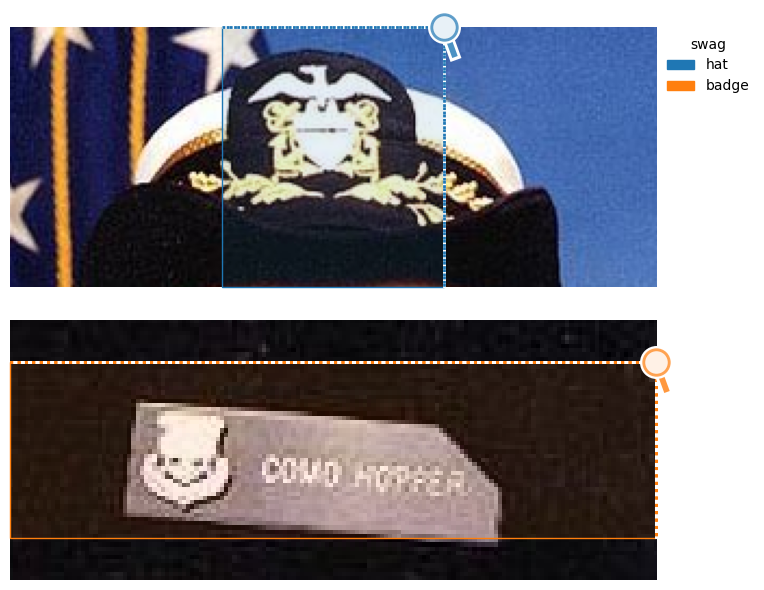
# load sample image
with mpl_cbook.get_sample_data("grace_hopper.jpg") as image_file:
    image = plt.imread(image_file)

h, w = image.shape[0], image.shape[1]

# initialize outset grid with specific marquee styles and positions
outset_grid = otst.OutsetGrid(
    data=otst_util.NamedFrames(  # allows for nice legend labels
        {  # (x0, y0, x1, y1) region to outset
            "hat": (0.42 * w, 0.78 * h, 0.62 * w, 0.98 * h),
            "badge": (0.10 * w, 0.14 * h, 0.40 * w, 0.21 * h),
        }
    ),
    aspect=2,
    col_wrap=1,  # stack subplots vertically
    col="swag",
    hue="swag",
    marqueeplot_kws={
        "mark_glyph": otst_mark.MarkMagnifyingGlass(),
        "mark_glyph_kws": {"markersize": 25},
        "frame_outer_pad": 0.0,  # make frame flush with subfigures
    },
    include_sourceplot=False,  # exclude original image
)

# add and position legend
outset_grid.add_legend()

# turn off axis accoutrements
outset_grid.broadcast(lambda: plt.axis("off"))
outset_grid.set_titles("")

# add content
outset_grid.broadcast(  # display image on all axes
    plt.imshow,
    image,
    extent=(0, w, 0, h),  # ensures ascending yaxis
    origin="upper",
    zorder=-1,
)

# display marquee plot, keeping even aspect
outset_grid.marqueeplot(preserve_aspect=True)

# move legend to the upper right of the figure
sns.move_legend(
    outset_grid.figure, "upper left", bbox_to_anchor=(0.95, 0.95), frameon=False
)

pass  # sponge up last return value, if any
No artists with labels found to put in legend.  Note that artists whose label start with an underscore are ignored when legend() is called with no argument.
No artists with labels found to put in legend.  Note that artists whose label start with an underscore are ignored when legend() is called with no argument.
/opt/hostedtoolcache/Python/3.10.13/x64/lib/python3.10/site-packages/seaborn/axisgrid.py:186: UserWarning: You have mixed positional and keyword arguments, some input may be discarded.
  figlegend = self._figure.legend(handles, labels, **kwargs)
[7]:
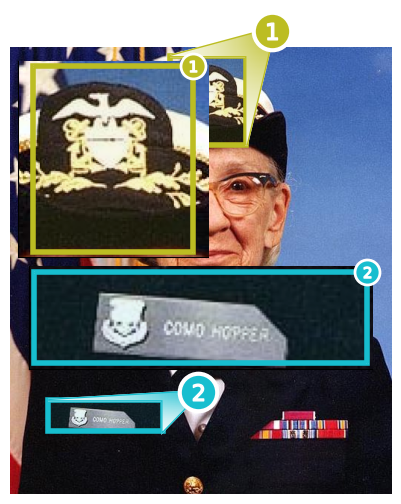
# load Grace Hopper image
with mpl_cbook.get_sample_data("grace_hopper.jpg") as image_file:
    image = plt.imread(image_file)

h, w = image.shape[0], image.shape[1]

# initialize outset grid with marqueeplot and source configurations
outset_grid = otst.OutsetGrid(
    data=[
        # (x0, y0, x1, y1) regions to outset
        (0.42 * w, 0.78 * h, 0.62 * w, 0.98 * h),
        (0.10 * w, 0.14 * h, 0.40 * w, 0.21 * h),
    ],  # frame coordinates
    aspect=w / h,
    height=5,  # make subplots  bigger via sns.FacetGrid
    marqueeplot_kws={
        "frame_inner_pad": 0.0,
        "frame_outer_pad": 0.05,
        "frame_outer_pad_unit": "inches",
        "frame_edge_kws": {"linewidth": 4, "linestyle": "-"},
        "leader_edge_kws": {"linewidth": 2, "linestyle": "-"},
        "leader_face_kws": {"alpha": 1.0},
        "mark_glyph_kws": {"markersize": 20},
    },
    marqueeplot_source_kws={
        "leader_stretch": 0.4,
        "leader_stretch_unit": "inches",
        "mark_glyph_kws": {"markersize": 30},
    },
    palette=sns.color_palette()[8:],  # custom palette
)

# turn off source axis ticks, spinees, etc.
outset_grid.source_axes.set_axis_off()

# display image in all subplots
outset_grid.broadcast(
    plt.imshow,
    image,
    aspect="equal",
    extent=(0, w, 0, h),
    origin="upper",
    zorder=-1,
)

# inset outsets with manually chosen positions and sizes
otst.inset_outsets(
    outset_grid,
    insets=[  # manually choose inset positions relative to source axes
        (0.02, 0.53, 0.50, 0.44),
        (0.05, 0.28, 0.9, 0.23),
    ],
)

# display marquee plot, keeping even aspect
outset_grid.marqueeplot(preserve_aspect=True)
pass  # sponge up last return value, if any
kdeplot
[8]:
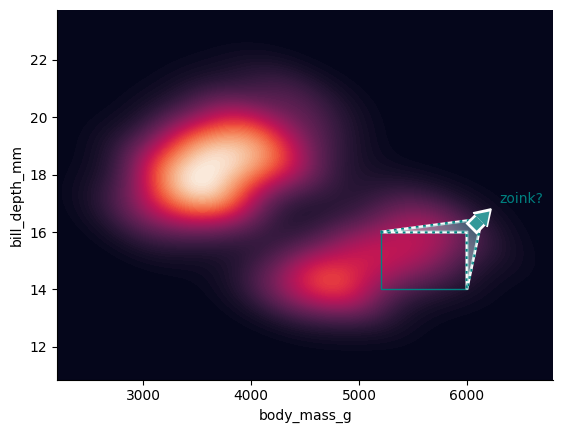
# adapted from https://seaborn.pydata.org/examples/smooth_bivariate_kde.html

# load penguins dataset
penguins_data = sns.load_dataset("penguins")

# create a single subplot
fig, ax = plt.subplots(1)

# plot a pretty kde
sns.kdeplot(
    data=penguins_data,
    x="body_mass_g",
    y="bill_depth_mm",
    ax=ax,
    fill=True,
    clip=((2200, 6800), (10, 25)),
    thresh=0,
    levels=100,
    cmap="rocket",  # color map
)

# manually draw marquee around an area of interest
otst.draw_marquee(
    (5200, 6000),  # x coordinates
    (14, 16),  # y coordinates
    ax,
    color="teal",
    mark_glyph=otst_mark.MarkArrow(rotate_angle=-45),  # arrow marker
    leader_stretch_unit="inches",
    leader_stretch=0.2,
    zorder=10,  # draw on top
)

# give the arrow something to point at
ax.annotate("zoink?", (6300, 17), color="teal", zorder=5)

pass  # sponge up last return value, if any
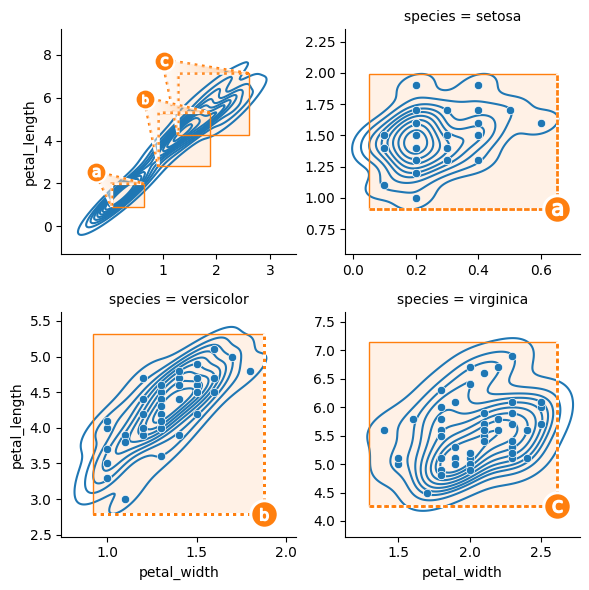
[9]:
# load Iris dataset and initialize outset grid with configurations
outset_grid = otst.OutsetGrid(
    data=sns.load_dataset("iris").dropna(),
    x="petal_width",
    y="petal_length",
    col="species",
    col_wrap=2,
    color=sns.color_palette()[1],  # force all marquees to have same color
    marqueeplot_kws={
        "mark_glyph": otst.mark.MarkAlphabeticalBadges,
    },
    marqueeplot_source_kws={"leader_tweak": otst_tweak.TweakReflect()},
    marqueeplot_outset_kws={
        "leader_tweak": otst_tweak.TweakReflect(vertical=True)
    },
)

# map kdeplot for petal width vs length on the main axes
outset_grid.map_dataframe(
    sns.kdeplot, x="petal_width", y="petal_length", legend=False, zorder=0
)

# map scatterplot for petal width vs length on the outset axes
outset_grid.map_dataframe_outset(
    sns.scatterplot,
    x="petal_width",
    y="petal_length",
    legend=False,
    zorder=0,
)

# dispatch marquee render
outset_grid.marqueeplot()

pass  # sponge up last return value, if any
[10]:
# load Iris dataset
iris_data = sns.load_dataset("iris").dropna()

# initialize outset grid with specific configurations
outset_grid = otst.OutsetGrid(
    aspect=1.5,
    data=iris_data,
    x="petal_width",
    y="petal_length",
    col="species",
    # hack to add two extra facets with no data
    col_order=sorted(iris_data["species"].unique()) + ["dummy1", "dummy2"],
    hue="species",
    marqueeplot_kws={"mark_glyph": otst.mark.MarkAlphabeticalBadges},
    marqueeplot_source_kws={"leader_tweak": otst_tweak.TweakReflect()},
    marqueeplot_outset_kws={
        "leader_tweak": otst_tweak.TweakReflect(vertical=True)
    },
)

# create two-layered KDE plot on source plot
outset_grid.map_dataframe_source(
    sns.kdeplot,
    x="petal_width",
    y="petal_length",
    alpha=0.4,
    fill=True,
    zorder=0,
)
outset_grid.map_dataframe_source(
    sns.kdeplot,
    x="petal_width",
    y="petal_length",
    alpha=0.4,
    zorder=0,
    levels=3,
)

# map regplot on outset subplots
outset_grid.map_dataframe_outset(
    otst.patched.regplot,
    x="petal_width",
    y="petal_length",
    line_kws={"lw": 1},
    scatter_kws={"s": 1},
)

# move and style legend
sns.move_legend(
    outset_grid.source_axes, loc="center left", bbox_to_anchor=(1, 0.5)
)
outset_grid.source_axes.get_legend().get_frame().set_linewidth(0.0)

# calculate insets positions and add insets to outset grid
# combine three upper left insets and two lower right insets
insets = otst_util.layout_corner_insets(
    3, "NW"
) + otst_util.layout_corner_insets(2, "SE")
otst.inset_outsets(outset_grid, insets=insets)

# draw on extra insets
# configure and plot KDE for petal width on specific outset axis
outset_grid.outset_axes[3].set_title("petal_width", fontsize=6)
outset_grid.outset_axes[3].set_aspect("auto")
outset_grid.outset_axes[3].set_autoscale_on(True)
sns.kdeplot(
    iris_data,
    x="petal_width",
    hue="species",
    fill=True,
    ax=outset_grid.outset_axes[3],
    legend=False,
    clip_on=False,
    bw_adjust=2,
)

# configure and plot KDE for petal length on specific outset axis
outset_grid.outset_axes[4].set_title("petal_length", fontsize=6)
outset_grid.outset_axes[4].set_aspect("auto")
outset_grid.outset_axes[4].set_autoscale_on(True)
sns.kdeplot(
    iris_data,
    x="petal_length",
    hue="species",
    fill=True,
    ax=outset_grid.outset_axes[4],
    legend=False,
    clip_on=False,
    bw_adjust=2,
)

# note: didn't dispatch marquee annotations!

pass  # sponge up last return value, if any
lineplot
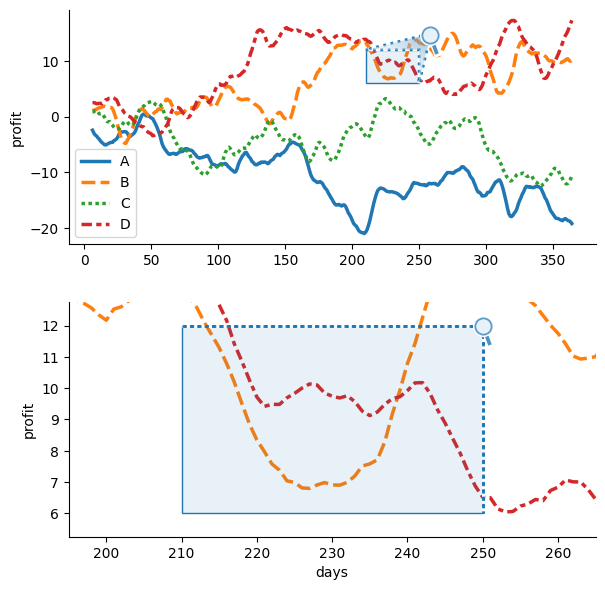
[11]:
# adapted from https://seaborn.pydata.org/examples/wide_data_lineplot.html

# generate random data and calculate rolling mean
random_state = np.random.RandomState(365)
values = random_state.randn(365, 4).cumsum(axis=0)
dates = np.array(range(365))
rolling_data = pd.DataFrame(values, dates, columns=["A", "B", "C", "D"])
rolling_data = rolling_data.rolling(7).mean()


# initialize axes grid manager
outset_grid = otst.OutsetGrid(
    aspect=2,  # make subplots wide
    data=[(210, 6, 250, 12)],  # (x0, y0, x1, y1) region to outset
    col_wrap=1,
    x="days",
    y="profit",
)

# broadcast lineplot to all subplots
outset_grid.broadcast(
    sns.lineplot,
    data=rolling_data,
    palette="tab10",
    linewidth=2.5,
    zorder=-1,
)

# dispatch marquee render
outset_grid.marqueeplot()

pass  # sponge up last return value, if any
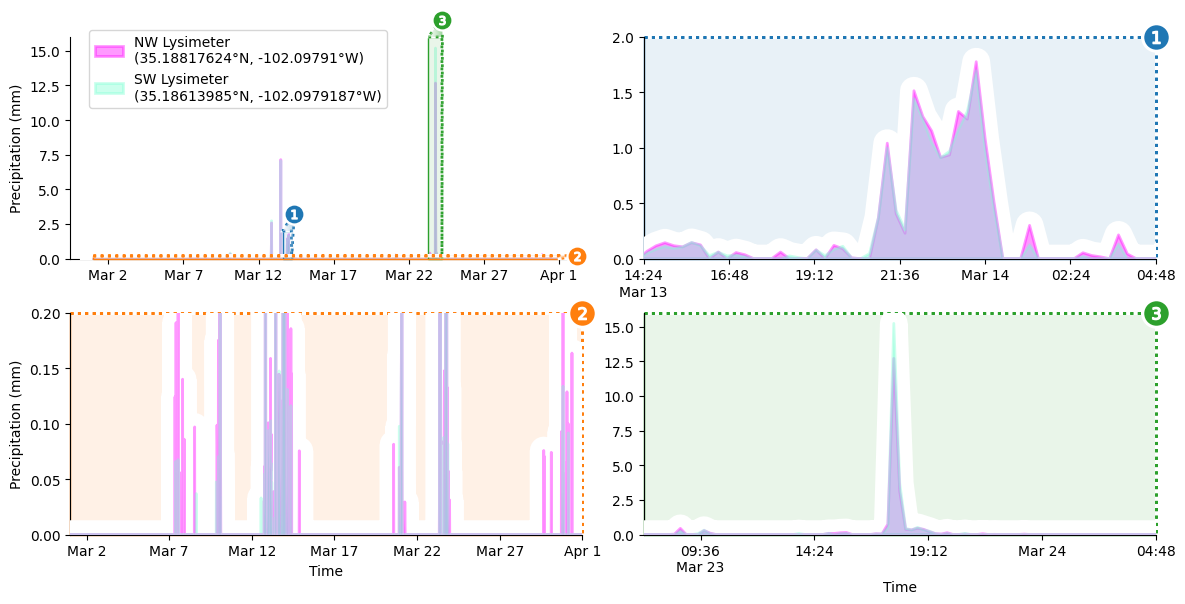
[12]:
# ----- prepare data -----
nwls = "NW Lysimeter\n(35.18817624°N, -102.09791°W)"
swls = "SW Lysimeter\n(35.18613985°N, -102.0979187°W)"
df = pd.read_csv("https://osf.io/6mx3e/download")
df[nwls] = df["NW precip in mm"]
df[swls] = df["SW precip in mm"]
df["Max precip"] = np.maximum(df["SW precip in mm"], df["NW precip in mm"])

march_df = df[  # filter down to just data from March 2019
    (df["Decimal DOY"] >= 59) & (df["Decimal DOY"] <= 90)
].reset_index()

# ----- setup axes grid -----
grid = otst.OutsetGrid(  # initialize axes grid manager
    data=[
        (71.6, 0, 72.2, 2),  # (x0, y0, x1, y1) region to outset
        (59, 0, 90, 0.2),
        (81.3, 0, 82.2, 16),
    ],
    x="Time",
    y="Max precip",
    marqueeplot_kws={"frame_outer_pad": 0, "mark_glyph_kws": {"zorder": 11}},
    marqueeplot_source_kws={"zorder": 10, "frame_face_kws": {"zorder": 10}},
    aspect=2,
    col_wrap=2,
)

# ----- plot content -----
grid.broadcast(  # apply white underlay for lineplot to all axes
    plt.stackplot,
    march_df["Decimal DOY"].to_numpy(),
    march_df["Max precip"].to_numpy(),
    colors=["white"],
    lw=20,
    edgecolor="white",
    zorder=10,
)
# draw semi-transparent filled lineplot on all axes for each lysimeter
for y, color in zip([nwls, swls], ["fuchsia", "aquamarine"]):
    grid.broadcast(
        plt.stackplot,
        march_df["Decimal DOY"].to_numpy(),
        march_df[y].to_numpy(),
        colors=[color],
        labels=[y],
        lw=2,
        edgecolor=color,
        alpha=0.4,
        zorder=10,
    )

# dispatch marquee render
grid.marqueeplot(equalize_aspect=False)  # allow axes aspect ratios to vary


# ----- replace numeric axes tick labels with datetimes -----
def to_dt(day_of_year: float, year: int = 2019) -> datetime:
    """Convert decimal day of the year to a datetime object."""
    return datetime(year=year, month=1, day=1) + timedelta(days=day_of_year)


def format_tick_value(
    prev_value: typing.Optional[mpl_text.Text],
    value: mpl_text.Text,
) -> str:
    decimal_doy = float(value.get_text())
    prev_decimal_doy = opyt.apply_if(prev_value, lambda x: float(x.get_text()))
    if int(decimal_doy) == opyt.apply_if(prev_decimal_doy, int):
        return to_dt(decimal_doy).strftime("%H:%M")
    elif decimal_doy % 1.0 < 1 / 24:
        return to_dt(decimal_doy).strftime("%b %-d")
    else:
        return to_dt(decimal_doy).strftime("%H:%M\n%b %-d")


for ax in grid.axes.flat:
    ax.set_xticks(
        # keep only x ticks that are within axes limits
        [val for val in ax.get_xticks() if np.clip(val, *ax.get_xlim()) == val]
    )
    ax.set_xticklabels(
        list(
            it.starmap(
                format_tick_value,
                it.pairwise((None, *ax.get_xticklabels())),
            ),
        ),
    )

# ----- finalize plot -----
grid.axes.flat[0].legend(
    loc="upper left",
    bbox_to_anchor=(0.08, 0.95),
    bbox_transform=grid.figure.transFigure,
    frameon=True,
)
grid.set_ylabels("Precipitation (mm)")

pass  # sponge up last return value, if any
patches
[13]:
# adapted from https://matplotlib.org/stable/gallery/shapes_and_collections/ellipse_demo.html

# Generate a sequence of random ellipses
NUM_ELLIPSES = 3000
ellipses = [
    mpl_patches.Ellipse(
        xy=np.random.rand(2) * 20,
        width=np.random.rand(),
        height=np.random.rand(),
        angle=np.random.rand() * 360,
        facecolor=np.random.rand(3),
        alpha=0.4,
        zorder=-2,
    )
    for _ in range(NUM_ELLIPSES)
]


# define plot function to add ellipses to axes
def draw_ellipses(ax):
    ax.set(
        xlim=(0, 20), ylim=(0, 20), aspect="equal"
    )  # set axis limits and aspect ratio

    for ellipse in ellipses:
        # note: must copy patches because each can only render one one axes
        ellipse_copy = copy.copy(ellipse)
        ax.add_artist(ellipse_copy)
        ellipse_copy.set_clip_box(ax.bbox)


# initialize outset grid with marqueeplot source configurations
outset_grid = otst.OutsetGrid(
    [(4, 4, 7, 6), (10, 10, 13, 12)],  # coordinates for marquee frames
    marqueeplot_source_kws=dict(
        frame_face_kws={"alpha": 0.5},
        leader_face_kws={"alpha": 1.0},
        leader_edge_kws={"ls": "-"},
    ),
)

# add content to all subplots
outset_grid.broadcast(draw_ellipses)

# display marquee plot
outset_grid.marqueeplot()

pass  # sponge up last return value, if any

[14]:
# adapted from https://matplotlib.org/stable/gallery/shapes_and_collections/ellipse_demo.html

# Generate a sequence of random ellipses
NUM_ELLIPSES = 3000
ellipses = [
    mpl_patches.Ellipse(
        xy=np.random.rand(2) * 20,
        width=np.random.rand(),
        height=np.random.rand(),
        angle=np.random.rand() * 360,
        facecolor=np.random.rand(3),
        alpha=0.4,
        zorder=-2,
    )
    for _ in range(NUM_ELLIPSES)
]


# define plot function to add ellipses to axes
def draw_ellipses(ax):
    ax.set(
        xlim=(0, 20), ylim=(0, 20), aspect="equal"
    )  # set axis limits and aspect ratio

    for ellipse in ellipses:
        # note: must copy patches because each can only render one one axes
        ellipse_copy = copy.copy(ellipse)
        ax.add_artist(ellipse_copy)
        ellipse_copy.set_clip_box(ax.bbox)


outset_grid = otst.OutsetGrid(
    [(4, 4, 5, 5)],  # choose area to outset
    marqueeplot_source_kws=dict(
        frame_face_kws={"alpha": 1.0, "color": "lightblue"},
        frame_inner_pad=0.3,
        leader_face_kws={"alpha": 1.0},
        leader_edge_kws={"ls": "-"},
    ),
)


# add content to all subplots
outset_grid.broadcast(draw_ellipses)

# reposition outset plots over source plot
otst.inset_outsets(outset_grid, strip_ticks=False)

# add white background to inset axes
for ax in outset_grid.outset_axes:
    outset_grid.source_axes.add_patch(
        mpl_patches.Rectangle(
            (-0.33, -0.25),
            1.5,
            1.5,
            transform=ax.transAxes,
            facecolor="white",
            edgecolor="none",
            zorder=-1,
        )
    )


# dispatch marquee render
outset_grid.marqueeplot()

pass
/opt/hostedtoolcache/Python/3.10.13/x64/lib/python3.10/site-packages/outset/_auxlib/draw_frame_.py:46: UserWarning: Setting the 'color' property will override the edgecolor or facecolor properties.
  frame_face_patch = mpl_patches.Rectangle(
plot
[15]:
# make some values to plot
x_values = np.linspace(0, 6, 10000)
y_values = np.sin(x_values) + np.cos(x_values * 100) * 0.01


# setup outset grid
outset_grid = otst.OutsetGrid(
    data=otst_util.NamedFrames(
        peak=(2.3 / 2, 0.95, 4 / 2, 1.05),  # coordinates for 'peak' frame
        mid=(2.9, -0.08, 3.4, 0.08),  # coordinates for 'mid' frame
    ),
    marqueeplot_kws={
        "mark_glyph": otst_mark.MarkAlphabeticalBadges(start="X")
    },  # start badges from 'X'
    col="region",  # used for autogenerated axis titles
    hue=False,  # ensure al marquees same color
)

# Broadcast the plot function to all subplots with orange color
outset_grid.broadcast(
    plt.plot,
    x_values,
    y_values,
    color="orange",
)

# render marquees
outset_grid.marqueeplot()

pass  # sponge up last return value, if any

regplot
[16]:
# initialize outset grid with iris dataset and specific configurations
outset_grid = otst.OutsetGrid(
    data=sns.load_dataset("iris"),
    x="petal_length",
    y="petal_width",
    col="species",
    hue="species",
    col_wrap=2,
    marqueeplot_source_kws={  # tweak callout geometry, just for source plot
        "leader_stretch": 0.07,
        "mark_retract": 0.25,
    },
    zorder=4,
)

# map kdeplot for petal length and width on source plots with legend disabled
outset_grid.map_dataframe_source(
    sns.kdeplot,
    x="petal_length",
    y="petal_width",
)

# map regplot for petal length and width on outset plots
# use wrapper around regplot from outset library to enable facet by hue
outset_grid.map_dataframe_outset(
    otst_patched.regplot,
    x="petal_length",
    y="petal_width",
)

# display marquee plot and add legend
outset_grid.marqueeplot()
outset_grid.add_legend()

pass  # sponge up last return value, if any
No artists with labels found to put in legend. Note that artists whose label start with an underscore are ignored when legend() is called with no argument.
scatterplot
[17]:
# adapted from https://seaborn.pydata.org/examples/scatter_bubbles.html

# initialize outset grid with specific configurations for marquee plot
outset_grid = otst.OutsetGrid(
    data=otst_util.NamedFrames(
        moped=(73.5, 23.5, 78.5, 31.5),  # (x0, y0, x1, y1) region to outset
    ),
    color="black",
    col="market",  # used for axis title
    marqueeplot_kws={
        "mark_glyph": otst.mark.MarkAlphabeticalBadges(start="A"),  # uppercase
        "frame_outer_pad": 0.2,
        "frame_outer_pad_unit": "inches",
        "frame_face_kws": {"facecolor": "none"},  # remove marquee frame fill
        "leader_face_kws": {"alpha": 1},
        "leader_edge_kws": {"lw": 2, "ec": "k", "alpha": 0.5},
        "leader_stretch": 0.8,
    },
)

# broadcast scatterplot with mpg dataset to all subplots
outset_grid.broadcast(
    sns.scatterplot,
    data=sns.load_dataset("mpg").dropna(),
    x="horsepower",
    y="mpg",
    hue="origin",
    size="weight",
    sizes=(40, 400),
    alpha=0.5,
    palette="muted",
    zorder=0,
)

# display marquee plot
# disable aspect equalization to fill outset axes with outset region
outset_grid.marqueeplot(equalize_aspect=False)
outset_grid.add_legend()

pass  # sponge up last return value, if any
[18]:
# adapted from https://seaborn.pydata.org/examples/scatter_bubbles.html

# initialize outset grid with specific marqueeplot configurations
outset_grid = otst.OutsetGrid(
    aspect=1.6,
    data=otst_util.NamedFrames(
        urban=(58.5, 30.5, 65.5, 38.5),
        rural=(73.5, 23.5, 78.5, 31.5),  # (x0, y0, x1, y1) region to outset
    ),
    # color=sns.color_palette()[-1],
    palette=sns.hls_palette(2),
    hue="consumer",
    marqueeplot_kws={  # tweak marquee plot geometry and style
        "frame_outer_pad": 0.2,
        "frame_outer_pad_unit": "inches",
        "frame_edge_kws": {"lw": 1, "ec": "k"},
        "frame_face_kws": {"facecolor": "none"},
        "leader_edge_kws": {"lw": 1, "ec": "k", "alpha": 0.5},
        "leader_face_kws": {"alpha": 0.8, "zorder": -2},
        "leader_stretch": 1,
    },
    marqueeplot_outset_kws={  # specialize outset marqueeplot configuraiton
        "frame_outer_pad": 0.1,
        "frame_outer_pad_unit": "axes",
        "leader_face_kws": {"alpha": 1.0},
        "leader_stretch": 0.15,
        "leader_stretch_unit": "inches",
    },
)
outset_grid.add_legend()

# broadcast scatterplot with mpg dataset to all subplots
outset_grid.broadcast(
    sns.scatterplot,
    data=sns.load_dataset("mpg").dropna(),
    x="horsepower",
    y="mpg",
    hue="origin",
    size="weight",
    sizes=(40, 400),
    alpha=0.5,
    palette="muted",
    zorder=0,
)

# scatterplot created a scatter legend, move it to the right of the figure
sns.move_legend(
    outset_grid.source_axes, loc="center left", bbox_to_anchor=(1, 0.3)
)
# style: remove figure box outline
outset_grid.source_axes.get_legend().get_frame().set_linewidth(0.0)

# move outset legend created earlier into position up top
sns.move_legend(outset_grid.figure, loc="center left", bbox_to_anchor=(0.8, 1))

# inset outsets without equalizing aspect and display marquee plot
otst.inset_outsets(outset_grid, equalize_aspect=False)
outset_grid.marqueeplot(equalize_aspect=False)

# set title for source axes, with newline to move it a little higher
outset_grid.source_axes.set_title("vroom vroom\n")

pass  # sponge up last return value, if any
No artists with labels found to put in legend.  Note that artists whose label start with an underscore are ignored when legend() is called with no argument.
No artists with labels found to put in legend.  Note that artists whose label start with an underscore are ignored when legend() is called with no argument.
No artists with labels found to put in legend.  Note that artists whose label start with an underscore are ignored when legend() is called with no argument.
/opt/hostedtoolcache/Python/3.10.13/x64/lib/python3.10/site-packages/seaborn/axisgrid.py:186: UserWarning: You have mixed positional and keyword arguments, some input may be discarded.
  figlegend = self._figure.legend(handles, labels, **kwargs)
[19]:
# initialize outset grid
outset_grid = otst.OutsetGrid(
    # pick marquee frame positions automatically from data
    data=sns.load_dataset("penguins").dropna(),
    x="bill_length_mm",
    y="bill_depth_mm",
    col="island",
    hue="species",  # split within columns using different colored marquees
    marqueeplot_kws={"mark_glyph": otst_mark.MarkRomanBadges},
    marqueeplot_source_kws={
        "leader_face_kws": {"alpha": 0.2},
        # this kwarg  pushes markers away from the region's centroid,
        # resolving overlap between blue marquee markers in source plot
        "leader_tweak": otst_tweak.TweakSpreadArea(
            spread_factor=(2, 2.5),
            xlim=(45.5, 52),
            ylim=(21, 24),
        ),
    },
)

# map scatterplot for bill length vs. depth
outset_grid.map_dataframe(
    sns.scatterplot,
    x="bill_length_mm",
    y="bill_depth_mm",
)

# display marquee plot, set axis labels, and add legend
outset_grid.marqueeplot()

# add nicer axis labels and a legend
outset_grid.set_axis_labels("bill length (mm)", "bill depth (mm)")
outset_grid.add_legend()

pass  # sponge up last return value, if any

[20]:
# initialize outset grid
outset_grid = otst.OutsetGrid(
    # pick marquee frame positions automatically from data
    data=sns.load_dataset("diamonds").dropna(),
    aspect=1.5,
    x="carat",
    y="price",
    hue="cut",  # split within columns using different colored marquees
    hue_order=["Good", "Fair"],
    col="cut",
    col_order=["Good", "Fair"],
    row="clarity",  # trick to subset outsets plots (not source) to IF clarity
    row_order=["IF"],  # note that row order contains only one item
    marqueeplot_kws={  # style marquee elements
        "mark_glyph": otst_mark.MarkRomanBadges,
        "leader_stretch": 0.4,
        "leader_tweak": otst_tweak.TweakReflect(),
    },
    marqueeplot_outset_kws={  # specialize marquee styling on outsets
        "leader_stretch": 0.2,
        "leader_stretch_unit": "inches",
        "leader_tweak": otst_tweak.TweakReflect(vertical=True),
        "mark_glyph_kws": {"zorder": 10},  # ensure glyph above axes
    },
)

# map scatterplot across faceted outset axes AND source axes
outset_grid.map_dataframe(
    otst_patched.scatterplot,  # patching for mwaskom/seaborn issue #3601
    x="carat",
    y="price",
    legend=False,
    marker=otst_util.SplitKwarg(  # specialize styling between source/outsets
        source="o", outset="+"
    ),
    alpha=otst_util.SplitKwarg(source=0.3, outset=1.0),
    s=otst_util.SplitKwarg(source=6, outset=20),  # marker size
    zorder=-2,  # ensure scatter behind marquees
)
# title source plot
outset_grid.source_axes.set_title("clarity = all | cut = {Fair, Good}")

otst.inset_outsets(  # rearrange move outset axes on top of source plot
    outset_grid,
    insets=otst_util.layout_corner_insets(  # lay out insets semi-manually
        2,  # two insets
        corner="SE",  # lower right corner
        inset_grid_size=(0.5, 1.0),
        inset_margin_size=(0, 0.05),
        inset_pad_ratio=(0.1, 0.3),
        transpose=True,  # stack insets vertically instead of side by side
    ),
    strip_titles=False,  # keep nice faceted titles
)
outset_grid.marqueeplot()  # render marquee annotations

pass  # sponge up last return value, if any
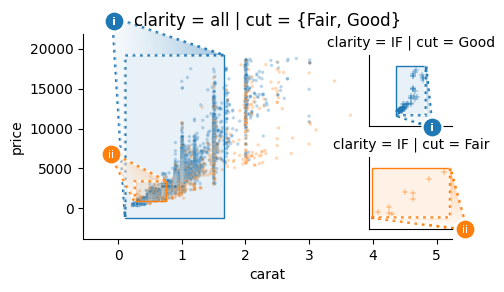
[21]:
# adapted from https://stackoverflow.com/a/72778992/17332200

xdata = [1, 2, 3, 4, 5, 55, 1, 6, 7, 24, 67, 33, 41, 75, 100_000, 1_000_000]
ydata = xdata[1:] + xdata[:1]  # slightly vary from x coords for nice plot
# Determine outlier status using 1.5x interquartile range threshold
outlier_bounds_x = otst_stub.CalcBoundsIQR(1.5)(xdata)
outlier_bounds_y = otst_stub.CalcBoundsIQR(1.5)(ydata)
is_outlier = (np.clip(xdata, *outlier_bounds_x) != xdata) | (
    np.clip(ydata, *outlier_bounds_y) != ydata
)

data = pd.DataFrame({"x": xdata, "y": ydata, "outlier": is_outlier})

# Initialize an OutsetGrid object
outset_grid = otst.OutsetGrid(
    data=data,
    x="x",
    y="y",
    col="outlier",  # split plots based on outlier status
    col_order=[False],  # only magnify non-outlier data
    marqueeplot_source_kws={  # style zoom indicator elements
        "leader_stretch": 0.5,
        "leader_stretch_unit": "inches",
    },
)

outset_grid.map_dataframe(sns.scatterplot, x="x", y="y")

otst.inset_outsets(outset_grid)  # rearrange move outset axes on top of source
outset_grid.marqueeplot()  # render marquee annotations

pass  # sponge up last return value, if any
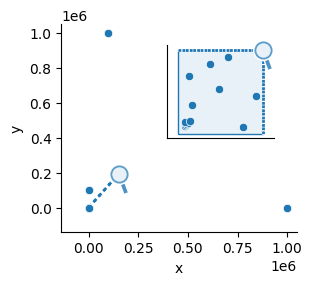
[22]:
# ----- prepare data -----
df = pd.read_csv("https://osf.io/bvrjm/download")
df["Wealth"] = (  # must out pesky non-numeric characters before conversion
    df["Net Worth"].str.replace(r"[^.0-9]+", "", regex=True).astype(float)
)
df["Who"] = (  # shorten by abbreviating first name and chopping long names
    df["Name"]
    .str.replace(r"\s*&.*", "", regex=True)
    .replace(r"(\b[A-Za-z])\w+\s+", r"\1. ", regex=True)
    .str.slice(0, 12)
)
df["Industry Rank"] = df.groupby("Industry")["Wealth"].rank(
    method="dense", ascending=False
)
focal_industries = [
    "Technology",
    "Fashion & Retail",
    "Sports",
    "Finance & Investments",
    "Automotive",
]

with plt.style.context("bmh"):  # temporarily switch matplotlib aesthetics
    # ----- setup axes grid -----
    grid = otst.OutsetGrid(  # setup axes grid manager
        df[(df["Industry Rank"] < 8)].dropna(),  # only top 8 in each industry
        x="Age",
        y="Wealth",
        col="Industry",
        col_order=focal_industries,
        hue="Industry",
        hue_order=focal_industries,
        aspect=1.5,  # widen subplots
        col_wrap=3,
    )

    # ----- plot content -----
    grid.map_dataframe(  # map scatterplot over all axes
        otst_patched.scatterplot,
        x="Age",
        y="Wealth",
        legend=False,
    )
    grid.map_dataframe_outset(  # map name annotations over all outset axes
        otst_patched.annotateplot,
        x="Age",
        y="Wealth",
        text="Who",
        fontsize=8,  # make text slightly smaller so it's easier to lay out
        rotation=-5,
        adjusttext_kws=dict(  # tweak fiddly params for text layout solver
            avoid_self=True,
            autoalign=True,
            expand_points=(1.8, 1.3),
            arrowprops=dict(arrowstyle="-", color="k", lw=0.5),
            expand_text=(1.8, 2),
            force_points=(1.2, 1),
            ha="center",
            va="top",
        ),
    )

    # ----- finalize plot -----
    grid.set_ylabels("Net Worth (Billion USD)")
    # render marquee annotations
    grid.marqueeplot(equalize_aspect=False)  # allow axes aspect ratios to vary

pass  # sponge up last return value, if any
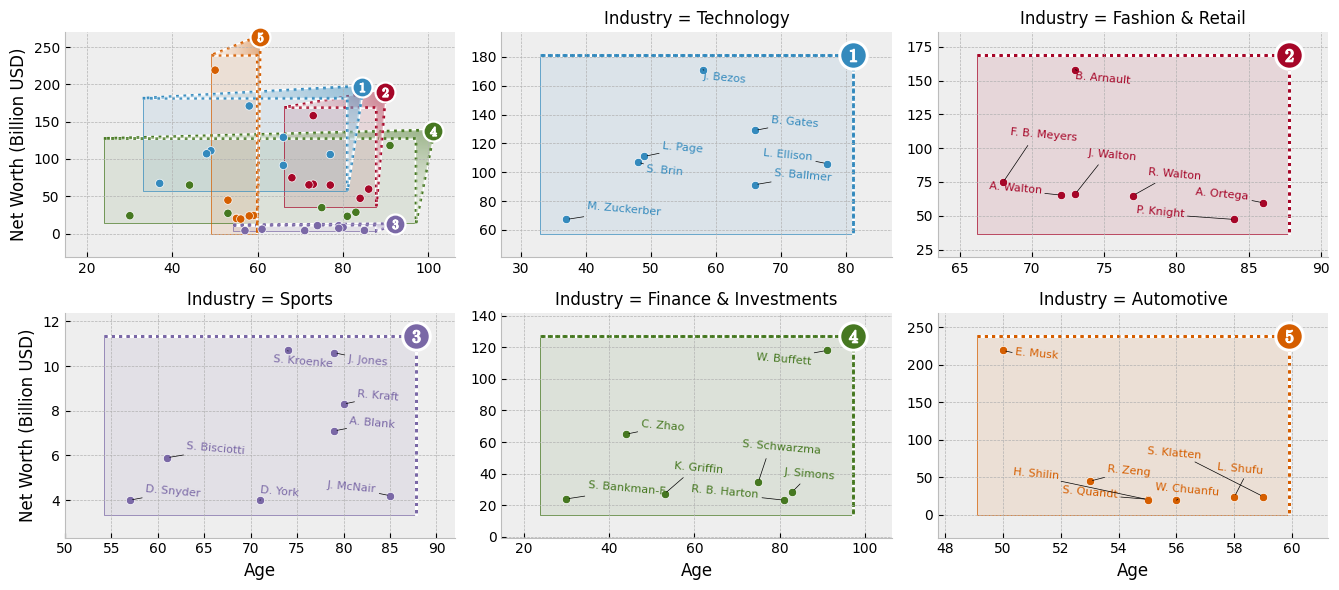
streamplot
[23]:
# adapted from # adapted from https://matplotlib.org/stable/gallery/images_contours_and_fields/plot_streamplot.html#streamplot

# set up grid and calculate stream flow
w = 3
Y, X = np.mgrid[-w:w:100j, -w:w:100j]
U = -1 - X**2 + Y
V = 1 + X - Y**2
speed = np.sqrt(U**2 + V**2)
args = [X, Y, U, V]

# create dummy axis for color reference
dummy_ax = plt.gca()
stream = dummy_ax.streamplot(
    *args,
    color=U,
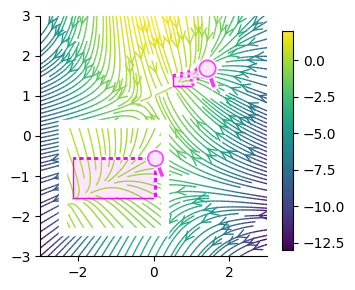
    cmap="viridis",
)
plt.close(dummy_ax.figure)

# initialize outset grid with marqueeplot configurations
outset_grid = otst.OutsetGrid(
    [(0.5, 1.25, 1, 1.5)],  # (x0, y0, x1, y1) region to outset
    color="fuchsia",
    marqueeplot_outset_kws={"color": "mediumorchid"},
    zorder=10,
)

# broadcast content across all axes
outset_grid.broadcast(
    plt.streamplot,
    *args,
    color=U,
    linewidth=1,
    cmap="viridis",
    # specialize style between source axes and outset axes
    density=otst_util.SplitKwarg(source=2, outset=6),
    arrowstyle="->",
    arrowsize=1.5,
)

# render marquees
outset_grid.marqueeplot()

# add color after rendering marquee to prevent layout issues
cbar = outset_grid.figure.colorbar(
    stream.lines,
    ax=outset_grid.axes.flat[-1],
    location="right",
    fraction=1e-9,  # minimize space stolen when inserting cbar axis
)
cbar.ax.set_position([1, 0.15, 0.2, 0.73])  # move and grow to size

pass  # sponge up last return value, if any
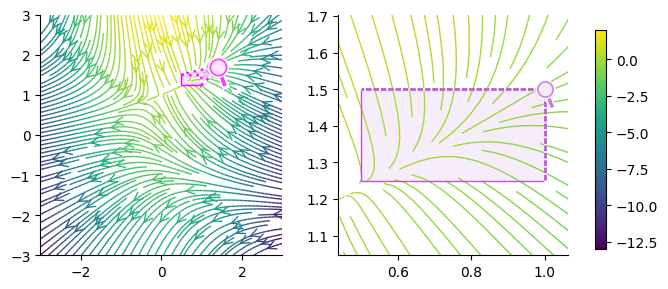
[24]:
# adapted from # adapted from https://matplotlib.org/stable/gallery/images_contours_and_fields/plot_streamplot.html#streamplot

# set up grid and calculate stream flow
w = 3
Y, X = np.mgrid[-w:w:100j, -w:w:100j]
U = -1 - X**2 + Y
V = 1 + X - Y**2
speed = np.sqrt(U**2 + V**2)
args = [X, Y, U, V]

# create dummy axis for color reference
dummy_ax = plt.gca()
stream = dummy_ax.streamplot(
    *args,
    color=U,
    cmap="viridis",
)
plt.close(dummy_ax.figure)

# initialize grid
og = otst.OutsetGrid(
    [(0.5, 1.25, 1, 1.5)],  # (x0, y0, x1, y1) region to outset
    color="fuchsia",
    zorder=10,
)

# draw content to all axes
og.broadcast(
    plt.streamplot,
    *args,
    color=U,
    linewidth=1,
    cmap="viridis",
    # specialize style between source axes and outset axes
    density=otst_util.SplitKwarg(source=2, outset=6),
    arrowstyle="->",
    arrowsize=1.5,
)

# render marquee annotations
og.marqueeplot()

# add the colorbar before insetting to prevent layout issues
cbar = og.figure.colorbar(
    stream.lines,
    ax=og.axes.flat[-1],
    location="right",
    fraction=1e-9,  # minimize space stolen when inserting cbar axis
)

# move outset axes onto source axis
otst.inset_outsets(
    og,
    insets="SW",
    equalize_aspect=False,
)
# thicken axes spines and set white to act like a frame around inset
for ax in og.outset_axes:
    for spine in ax.spines.values():
        spine.set_linewidth(6)
        spine.set_edgecolor("white")
        spine.set_visible(True)

# grow c bar and move into position
cbar.ax.set_position([1, 0.15, 0.2, 0.73])

pass  # sponge up last return value, if any
