Profiling Custom Memory Allocators
contents
Who else likes speedups where you just trade the family cow for magic ~beans~ flags and don’t even have to change your code base?
![]() I know I do!
I know I do!
This week I’m profiling the scalability of the DISHTINY software. That way, I’ll be able to figure out where to focus development attention to improve scalability.
As a first stab, I decided to investigate custom memory allocators designed for multithreading. These allocators promise better thread locality and reduced false sharing. I figured that if I was able to see a big performance boost on high thread counts using a custom memory allocator then looking more closely at how DISHTINY organizes data in memory might be more worthwhile.
🔗 Custom Memory Allocators
Turns out there’s a whole cottage industry of custom memory allocators:
- Google’s Thread-Caching Malloc
- Microsoft’s mimalloc
- LightweighT Almost Lock-Less Oriented for C++ programs memory allocator
- Mesh: Compacting Memory Management for C/C++
- RP Memory Allocator
- smmalloc
- dlmalloc
- Hoard Memory Allocator
- jemalloc
- Allocators in Rust
These are actually pretty easy to plug-and-play with.
Basically, you just build to a blah.so file and then replace the default allocator with export LD_PRELOAD=/path/to/blah.so before running your executable.
No compile time changes required!
I tested with default malloc, mimalloc, and Hoard.
🔗 Methods
I collected timing data with 1, 4, and 16 threads enabled on a 16 cpu allocation on MSU ICER’s lac-247 node.
Timing data was collected at three “load” (work per thread) levels: 1, 4, and 16.
(Intuition: a one-thread run with load level 16 conducts the same amount of total work as a sixteen-thread run with load level 1.)
Six replicate measurements of each timing were recorded.
I profiled version 53vgh of the DISHTINY software [Moreno and Ofria, 2020], compiled with data collection disabled. This software is built using the Empirical C++ Library [Ofria et al., 2019].
I performed one data collection session using a variant of Script OEFFA for each of default malloc, mimalloc, and Hoard. Then, I knit the data files from each session together using Script IFDFD.
🔗 Results & Discussion
Figure RTISA compares timings using each allocator across load levels/thread counts. For all experiments with load levels of 4 and 16, including serial execution, mimalloc outperformed default malloc and Hoard (non-overlapping 95% CI) Better performance by mimalloc at load level 1 may have been partially obscured by execution time variance and measurement error due to the short (~1 second) runtimes. Overall, mimalloc, which appears to provide a nice speedup of around 10 to 20%, appears the best choice to use going forward.
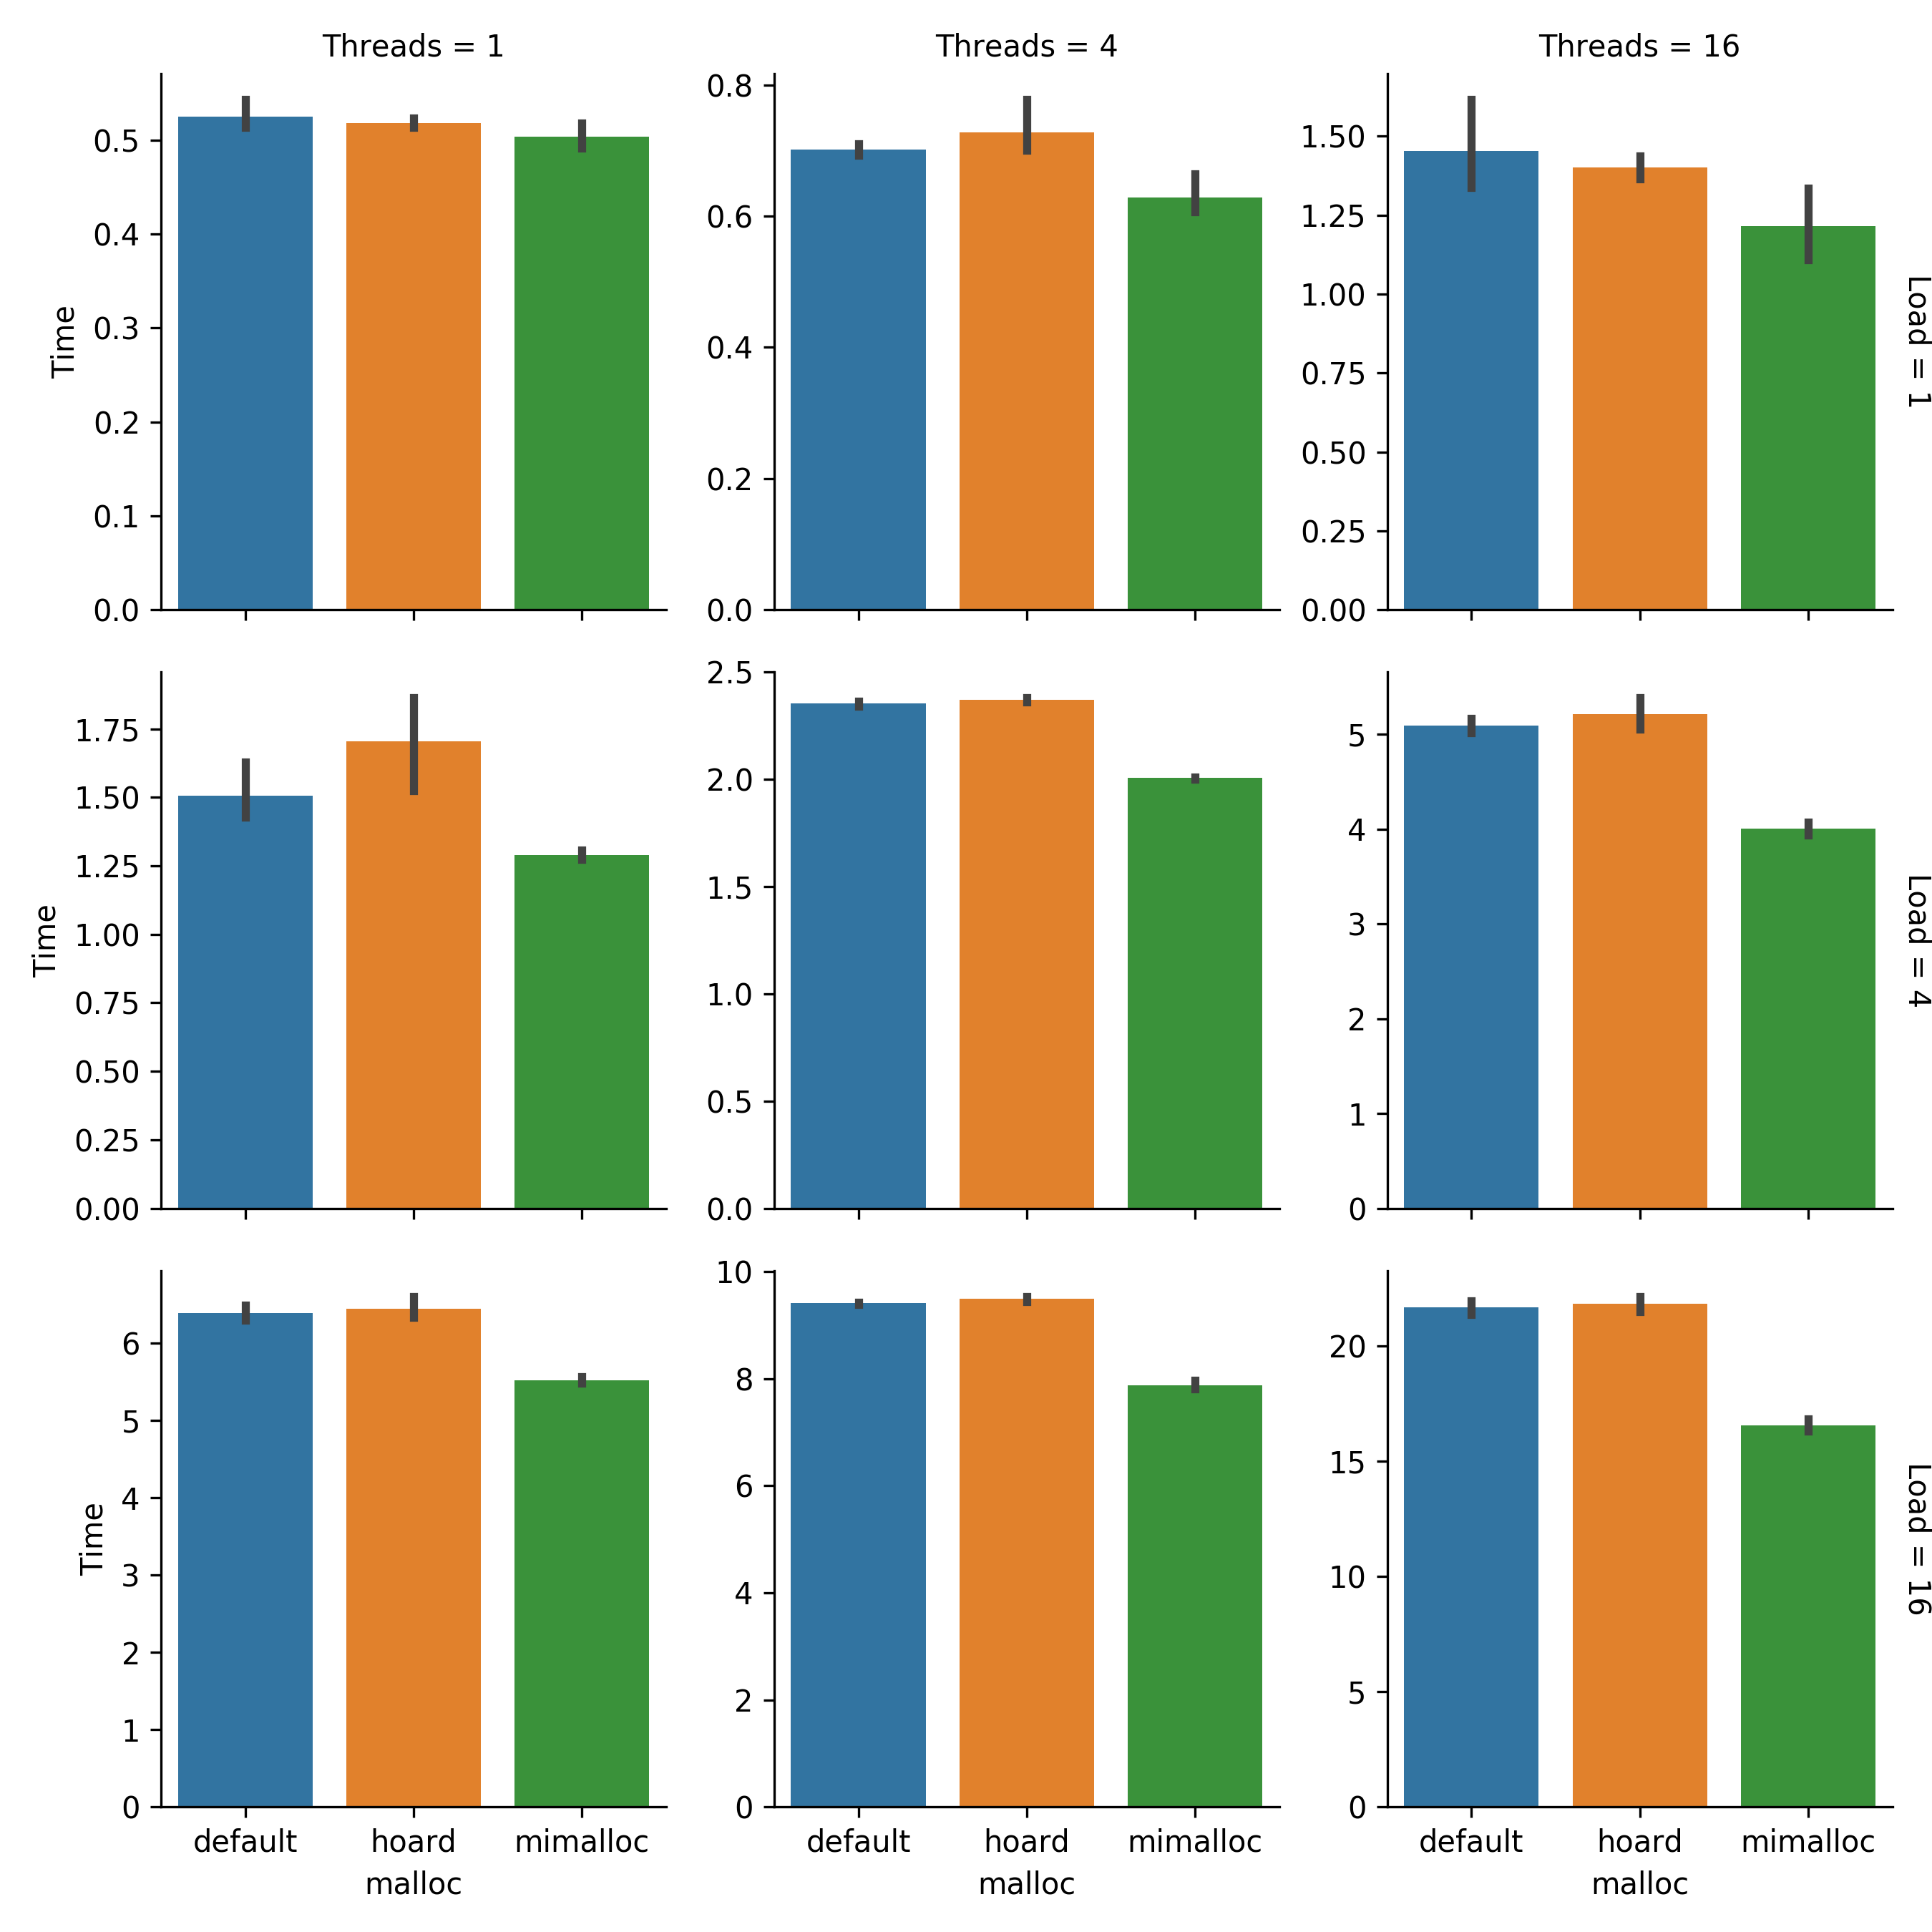 Figure RTISA:
Raw timings, in seconds, at each thread count/load level combination.
Error bars are bootstrapped 95% CI.
Note that \(y\)-axes aren’t shared.
Created via Script IIIDG.
Figure RTISA:
Raw timings, in seconds, at each thread count/load level combination.
Error bars are bootstrapped 95% CI.
Note that \(y\)-axes aren’t shared.
Created via Script IIIDG.
Figure COSMI compares how multi-threaded timings scale relative to serial timings.
Ideally, under the same per-thread load, multi-thread timings would be identical to serial timings. However, due to the overhead of thread synchronization, this typically is not the case.
To prepare Figure COSMI, each timing was normalized by the mean execution time of the corresponding allocator and load level test with one thread. In the Threads = 1 column, as expected all serial timings have been normalized to 1.0. However, in the Threads = 16 column at load levels 4 and 16, mimalloc exhibits runtimes that are a lower multiple of serial runtime than default malloc (non-overlapping 95% CI). This indicates that mimalloc isn’t just reducing overall runtime by a constant factor: mimalloc bolsters performance more at high thread count.
Because mimalloc can alter memory layout in ways that affect performance in particular in a multithreaded context, memory layout does seem to be relevant to scaling performance. So, looking more closely at how DISHTINY organizes data in memory might indeed be worthwhile.
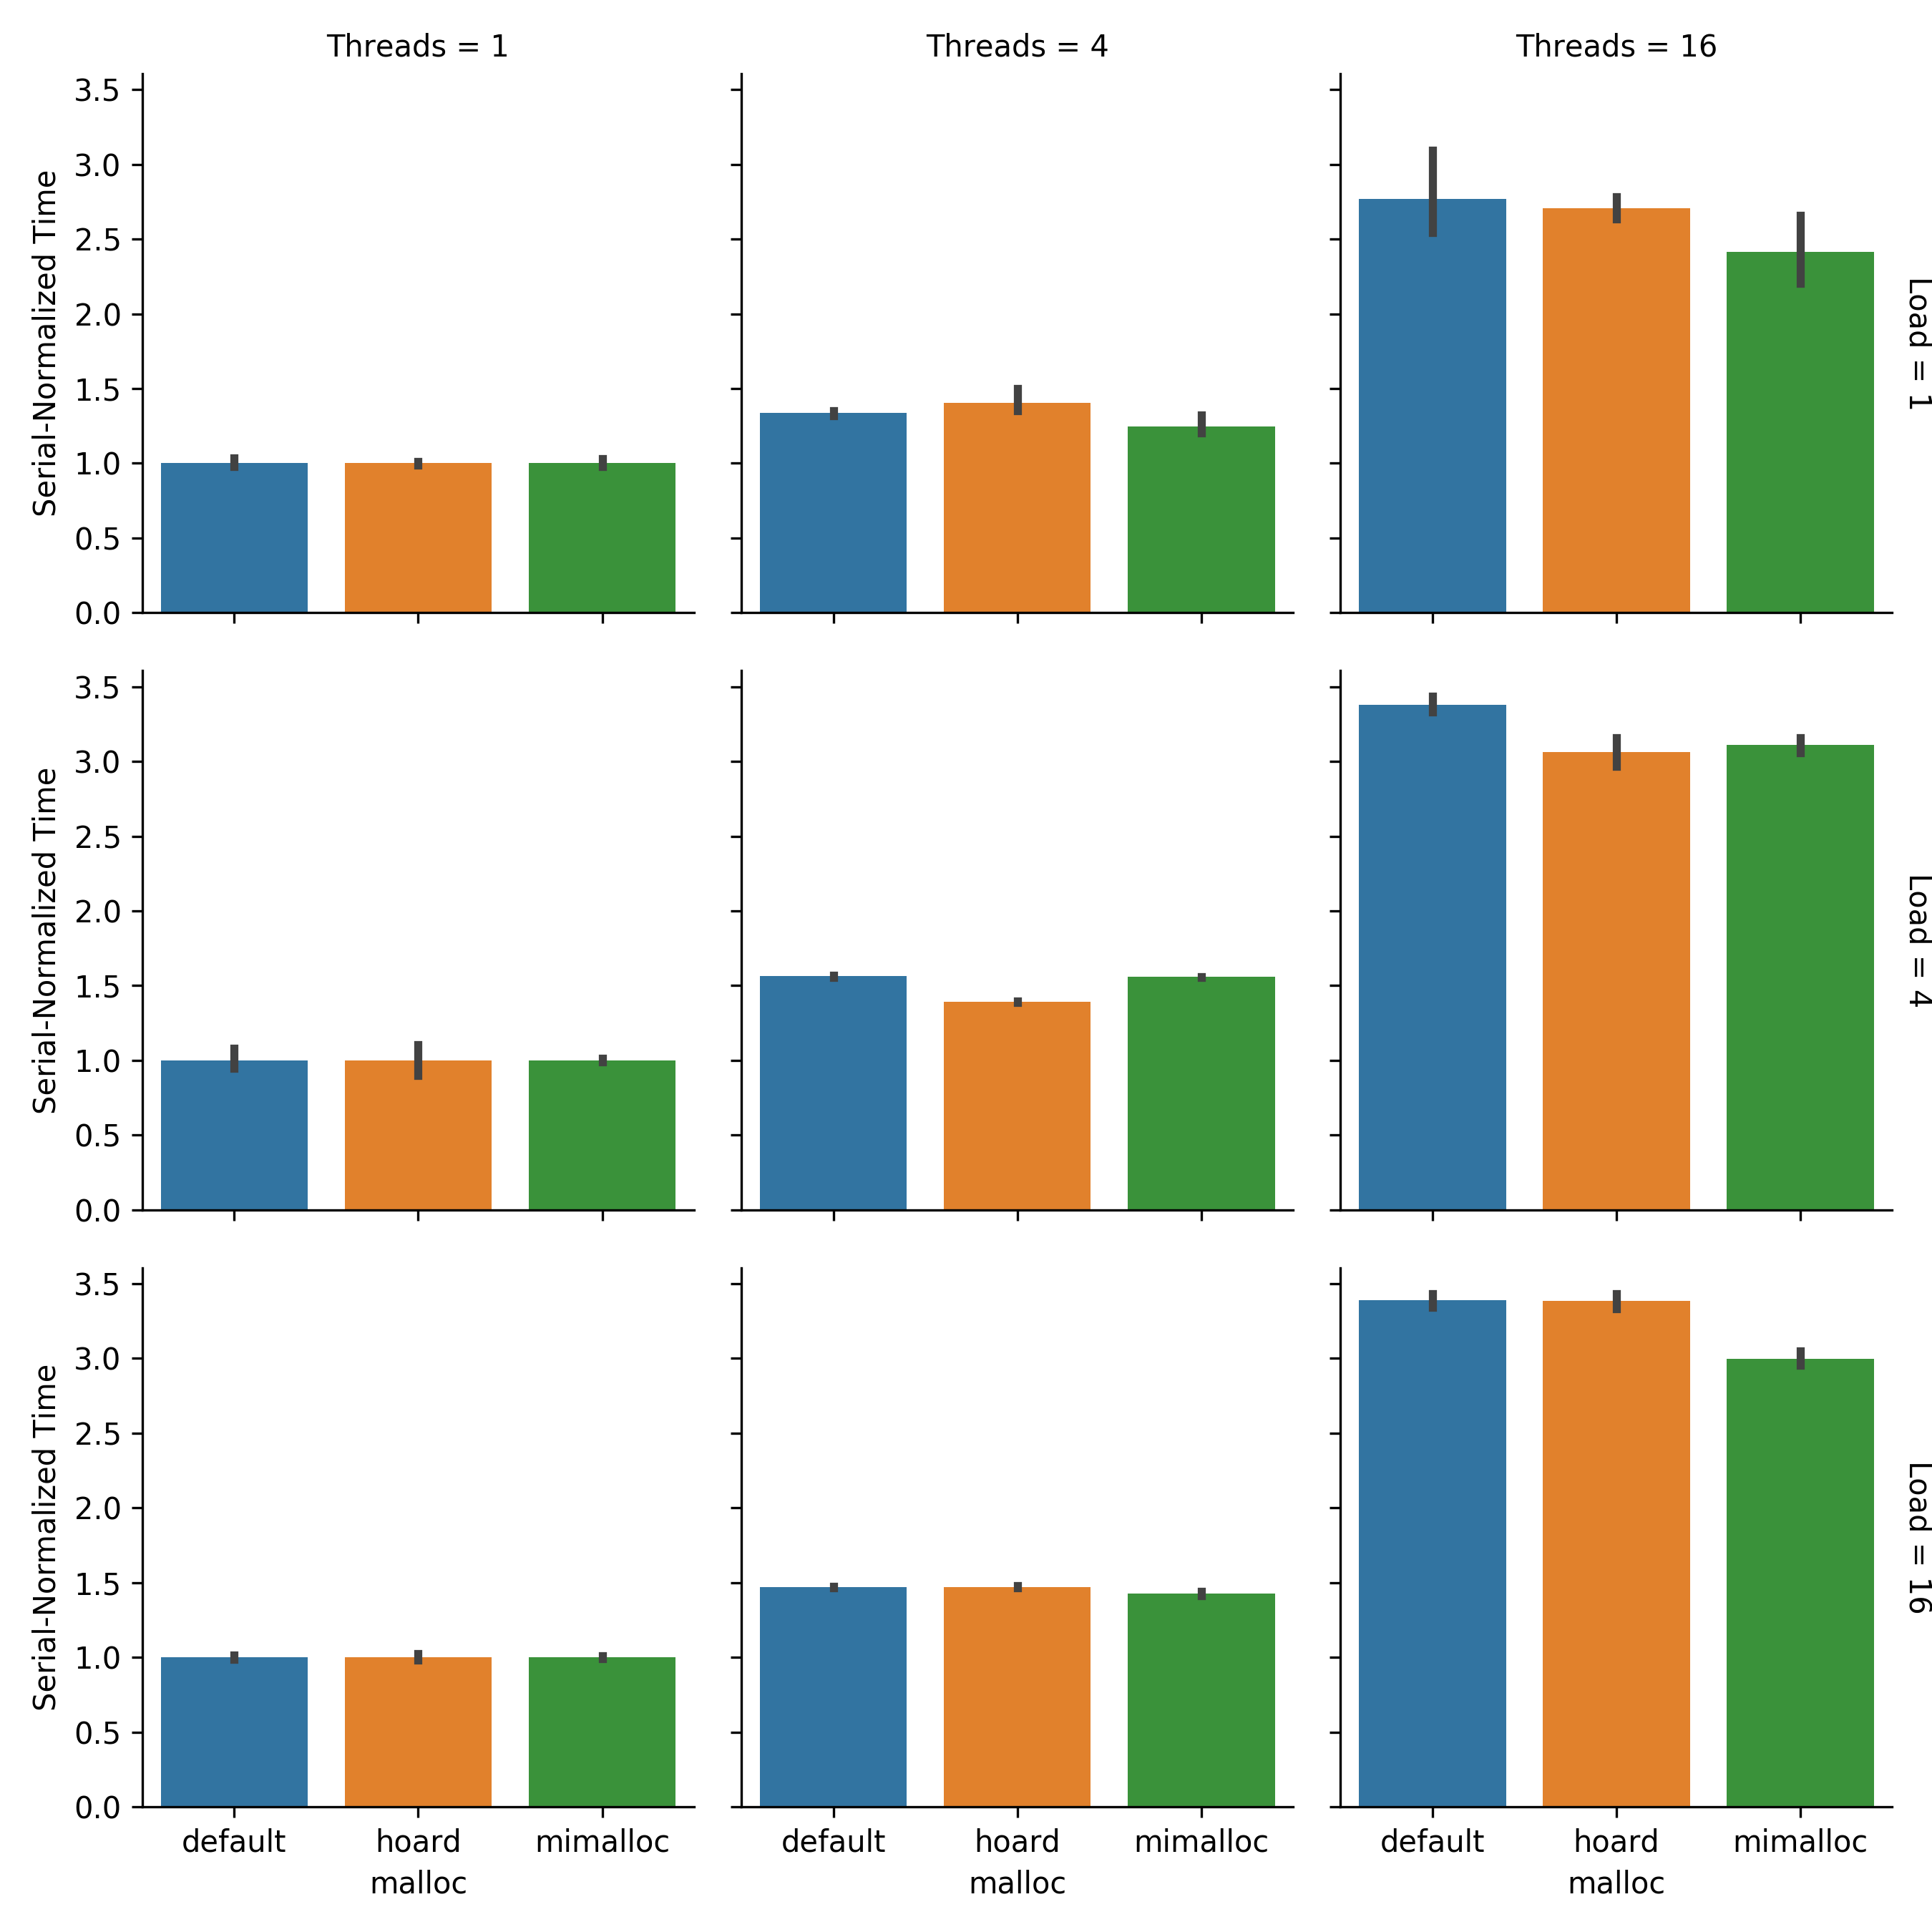 Figure COSMI:
Comparison of serial-normalized timings by malloc implementation.
Timings are normalized to each malloc/load level’s serial performance.
Error bars are bootstrapped 95% CI.
Created via Script IIIDD.
Figure COSMI:
Comparison of serial-normalized timings by malloc implementation.
Timings are normalized to each malloc/load level’s serial performance.
Error bars are bootstrapped 95% CI.
Created via Script IIIDD.
Finally, Figure COSLL. Serial-normalized timings are similar across load levels at thread count 4. However, at thread count 16 load level 1 runs have lower serial-normalized timings across all allocators.
At first blush, this result appears somewhat counterintuitive. Load level 1 runs have a lower amount of total work. So, we would expect synchronization costs to represent a greater overall fraction of runtime at low load levels. Thus, we would expect serial-normalized timing to be greater, not lesser, at low load level.
Flat overhead (e.g., program setup and tear-down) may be behind this result. This flat overhead represents a greater fraction of runtime for the shorter low load runs. So, run time increases due to multithread synchronization represent a lower overall fraction of runtime.
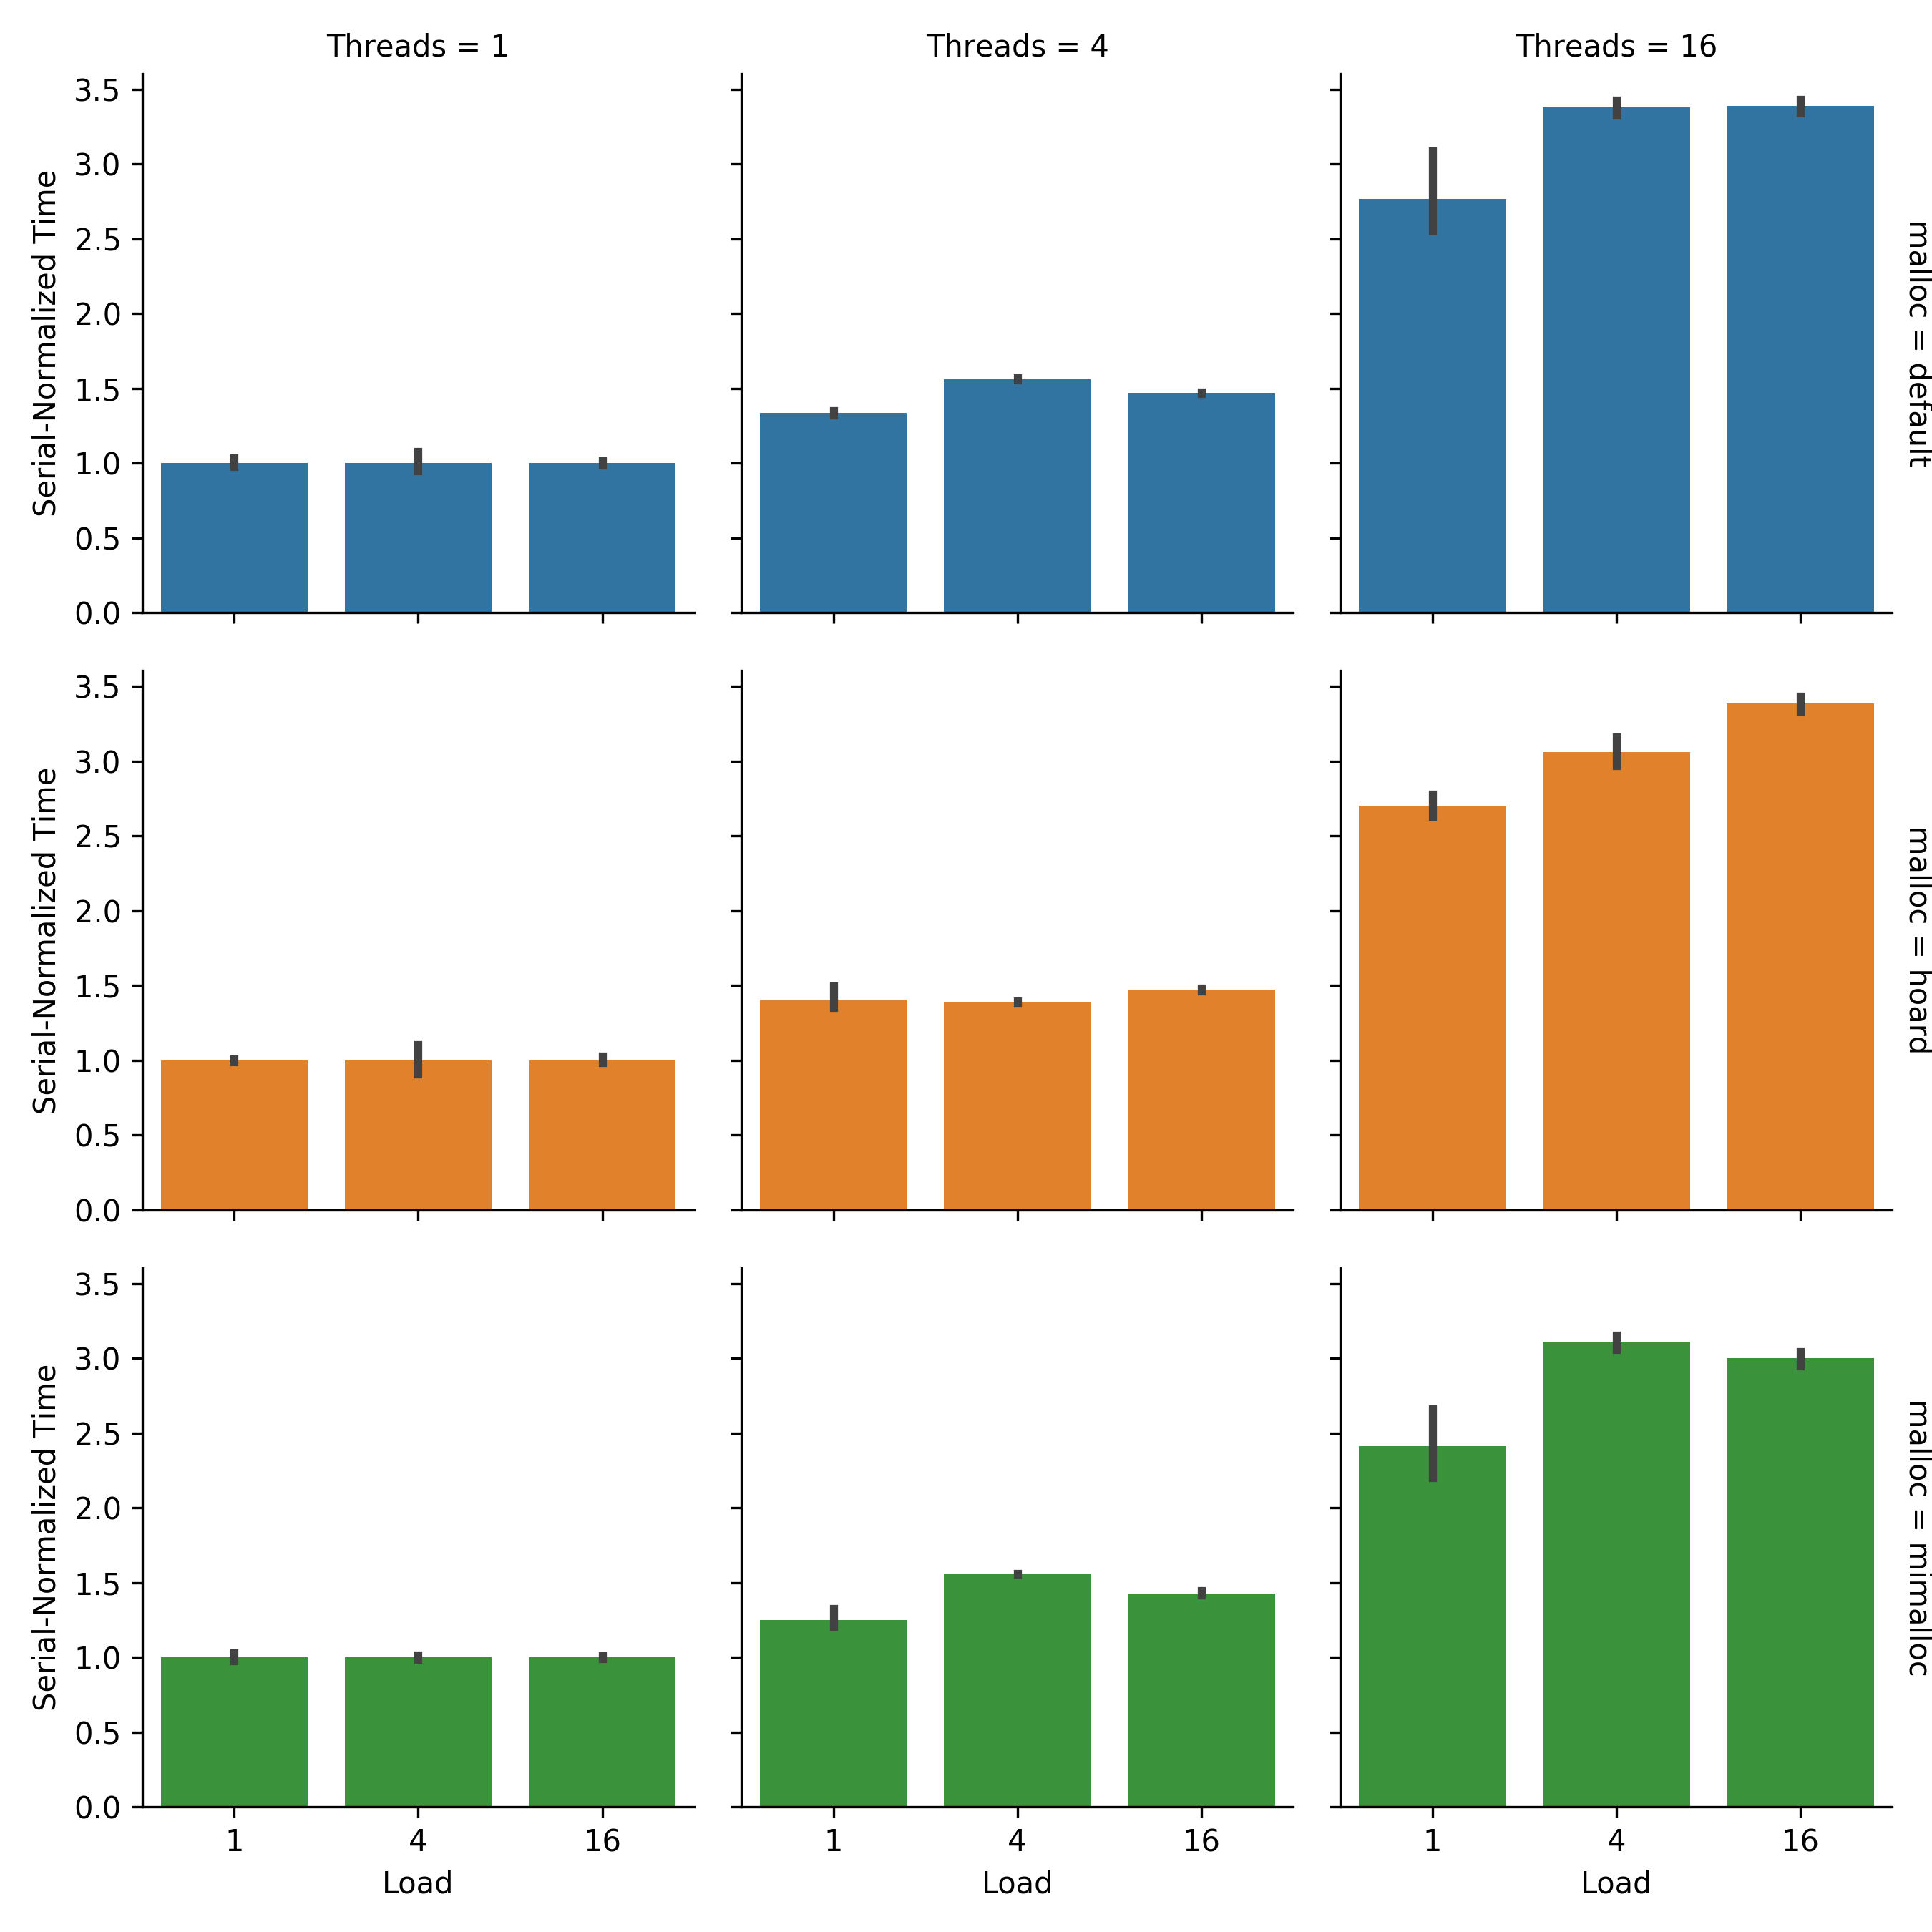 Figure COSLL:
Comparison of serial-normalized timings by load level.
Timings are normalized to each malloc/load level’s serial performance.
Error bars are bootstrapped 95% CI.
Created via Script IIIDD.
Figure COSLL:
Comparison of serial-normalized timings by load level.
Timings are normalized to each malloc/load level’s serial performance.
Error bars are bootstrapped 95% CI.
Created via Script IIIDD.
🔗 Conclusion
Mimalloc is performant.
Memory layout seems to have particular consequences relevant to multithread performance.
🔗 Cite This Post
APA
Moreno, M. A. (2020, July 3). Profiling Custom Memory Allocators. https://doi.org/10.17605/OSF.IO/VWF5G
MLA
Moreno, Matthew A. “Profiling Custom Memory Allocators.” OSF, 3 July 2020. Web.
Chicago
Moreno, Matthew A. 2020. “Profiling Custom Memory Allocators.” OSF. July 3. doi:10.17605/OSF.IO/VWF5G.
BibTeX
@misc{Moreno-2020,
  title={Profiling Custom Memory Allocators},
  url={osf.io/vwf5g},
  DOI={10.17605/OSF.IO/VWF5G},
  publisher={OSF},
  author={Moreno, Matthew A},
  year={2020},
  month={Jul}
}
🔗 Let’s Chat!
Questions? Comments?
I started a twitter thread (right below) so we can chat ![]()
![]()
![]()
nothing to see here, just a placeholder tweet 🐦
— Matthew A Moreno (@MorenoMatthewA) October 21, 2018
Pop on there and drop me a line ![]() or make a comment
or make a comment ![]()
🔗 References
🔗 Acknowledgements
This research was supported in part by NSF grants DEB-1655715 and DBI-0939454, and by Michigan State University through the computational resources provided by the Institute for Cyber-Enabled Research. This material is based upon work supported by the National Science Foundation Graduate Research Fellowship under Grant No. DGE-1424871. Any opinions, findings, and conclusions or recommendations expressed in this material are those of the author(s) and do not necessarily reflect the views of the National Science Foundation.
🔗 Scripts
OUT_FILE="malloc=default+ext=.csv"
echo "Threads,Work,Load,Replicate,Time" > $OUT_FILE
for NUM_THREADS in 1 4 16; do
  for LOAD_PER in 1 4 16; do
    AMT_WORK=$(( $NUM_THREADS * $LOAD_PER ))
    for REP in {0..5}; do
      echo "NUM_THREADS: ${NUM_THREADS}"
      echo "AMT_WORK: ${AMT_WORK}"
      echo "LOAD_PER: ${LOAD_PER}"
      echo "REP: ${REP}"
      export OMP_NUM_THREADS=$NUM_THREADS
      export DIM=$(bc <<< "sqrt(${AMT_WORK} * 100)")
      echo "DIM: ${DIM}"
      /usr/bin/time -f "%e" -o tmp \
        ./dishtiny -RUN_LENGTH 200 -GRID_W ${DIM} -GRID_H ${DIM} \
        > /dev/null 2>&1
      ELAPSED_TIME=$(cat tmp)
      echo "ELAPSED_TIME: ${ELAPSED_TIME}"
      echo "${NUM_THREADS},${AMT_WORK},${LOAD_PER},${REP},${ELAPSED_TIME}" >> $OUT_FILE
    done;
  done;
done
import pandas as pd
from keyname import keyname as kn

dfs = []
for malloc in "default", "hoard", "mimalloc":
  df = pd.read_csv(kn.pack({
    "malloc" : malloc,
    "ext" : ".csv",
  }))
  df["malloc"] = malloc
  dfs.append(df)


df = pd.concat(dfs)

df["Aggregate Throughput"] = df.apply(
  lambda row: row["Work"] / row["Time"],
  axis=1,
)

df["Marginal Throughput"] = df.apply(
  lambda row: row["Load"] / row["Time"],
  axis=1,
)

df.to_csv(
  'knitted.csv',
  index=False,
)
import pandas as pd
import seaborn as sns
import matplotlib.pyplot as plt

df = pd.read_csv("knitted.csv")

g = sns.FacetGrid(
  df,
  col="Threads",
  row="Load",
  hue="malloc",
  margin_titles="true",
  sharey=False,
)

g.map(
  sns.barplot,
  "malloc",
  "Time",
  order=df['malloc'].unique(),
)

plt.savefig(
  "malloc-profile-summary.png",
  transparent=True,
  dpi=300,
)
import pandas as pd
import seaborn as sns
import matplotlib.pyplot as plt

df = pd.read_csv("knitted.csv")

def normalize_time(row):
  mean_serial_time = df[
    (df['malloc'] == row['malloc'])
    & (df['Load'] == row['Load'])
    & (df['Threads'] == 1)
  ]['Time'].mean()
  return row['Time'] / mean_serial_time

df['Serial-Normalized Time'] = df.apply(
  normalize_time,
  axis=1,
)

g = sns.FacetGrid(
  df,
  col="Threads",
  row="Load",
  hue="malloc",
  margin_titles="true",
)

g.map(
  sns.barplot,
  "malloc",
  "Serial-Normalized Time",
  order=df['malloc'].unique(),
)

plt.savefig(
  "malloc-profile-serial-normalized-time.png",
  transparent=True,
  dpi=300,
)

plt.clf()

g = sns.FacetGrid(
  df,
  col="Threads",
  row="malloc",
  hue="malloc",
  margin_titles="true",
)

g.map(
  sns.barplot,
  "Load",
  "Serial-Normalized Time",
)

plt.savefig(
  "malloc-profile-serial-normalized-time-by-load.png",
  transparent=True,
  dpi=300,
)