
Systematics Normalization
🔗 Systematics Normalization
I collaborated on this project with my mentors, Emily Dolson (www.emilyldolson.com) and Kate Skocelas (https://github.com/kgskocelas). This project is part of Empirical. Empirical is a library of C++ tools for developing scientific software.
🔗 Goal:
The purpose of this project is to develop a way to compare phylogenetic trees of different sizes and characteristics in a standardized way.
🔗 Motivation:
Within the Empirical library and the field of evolutionary biology in general, there is not a good way to compare phylogenetic trees with one another. Different tree sizes and characteristics make it hard to obtain statistically useful data in terms of comparison. The work done in digital evolution has made this particularly apparent. While other projects have aimed to solve this problem, there isn’t currently a good method that accounts for a variety of constraints such as tree depth, different pressures for diversity, etc. This project aims to solve this.
🔗 Experiment Outline
-
Creation of a null model of a phylogenetic tree
- Creation of a tree that mutates and diverges in a non-random way
- Creation of a tree which accounts for pressure for diversity and mutation
- Comparing trees from steps 2 and 3 with each other and the null model
🔗 Background and Definitions
🔗 Phylogenetic Trees
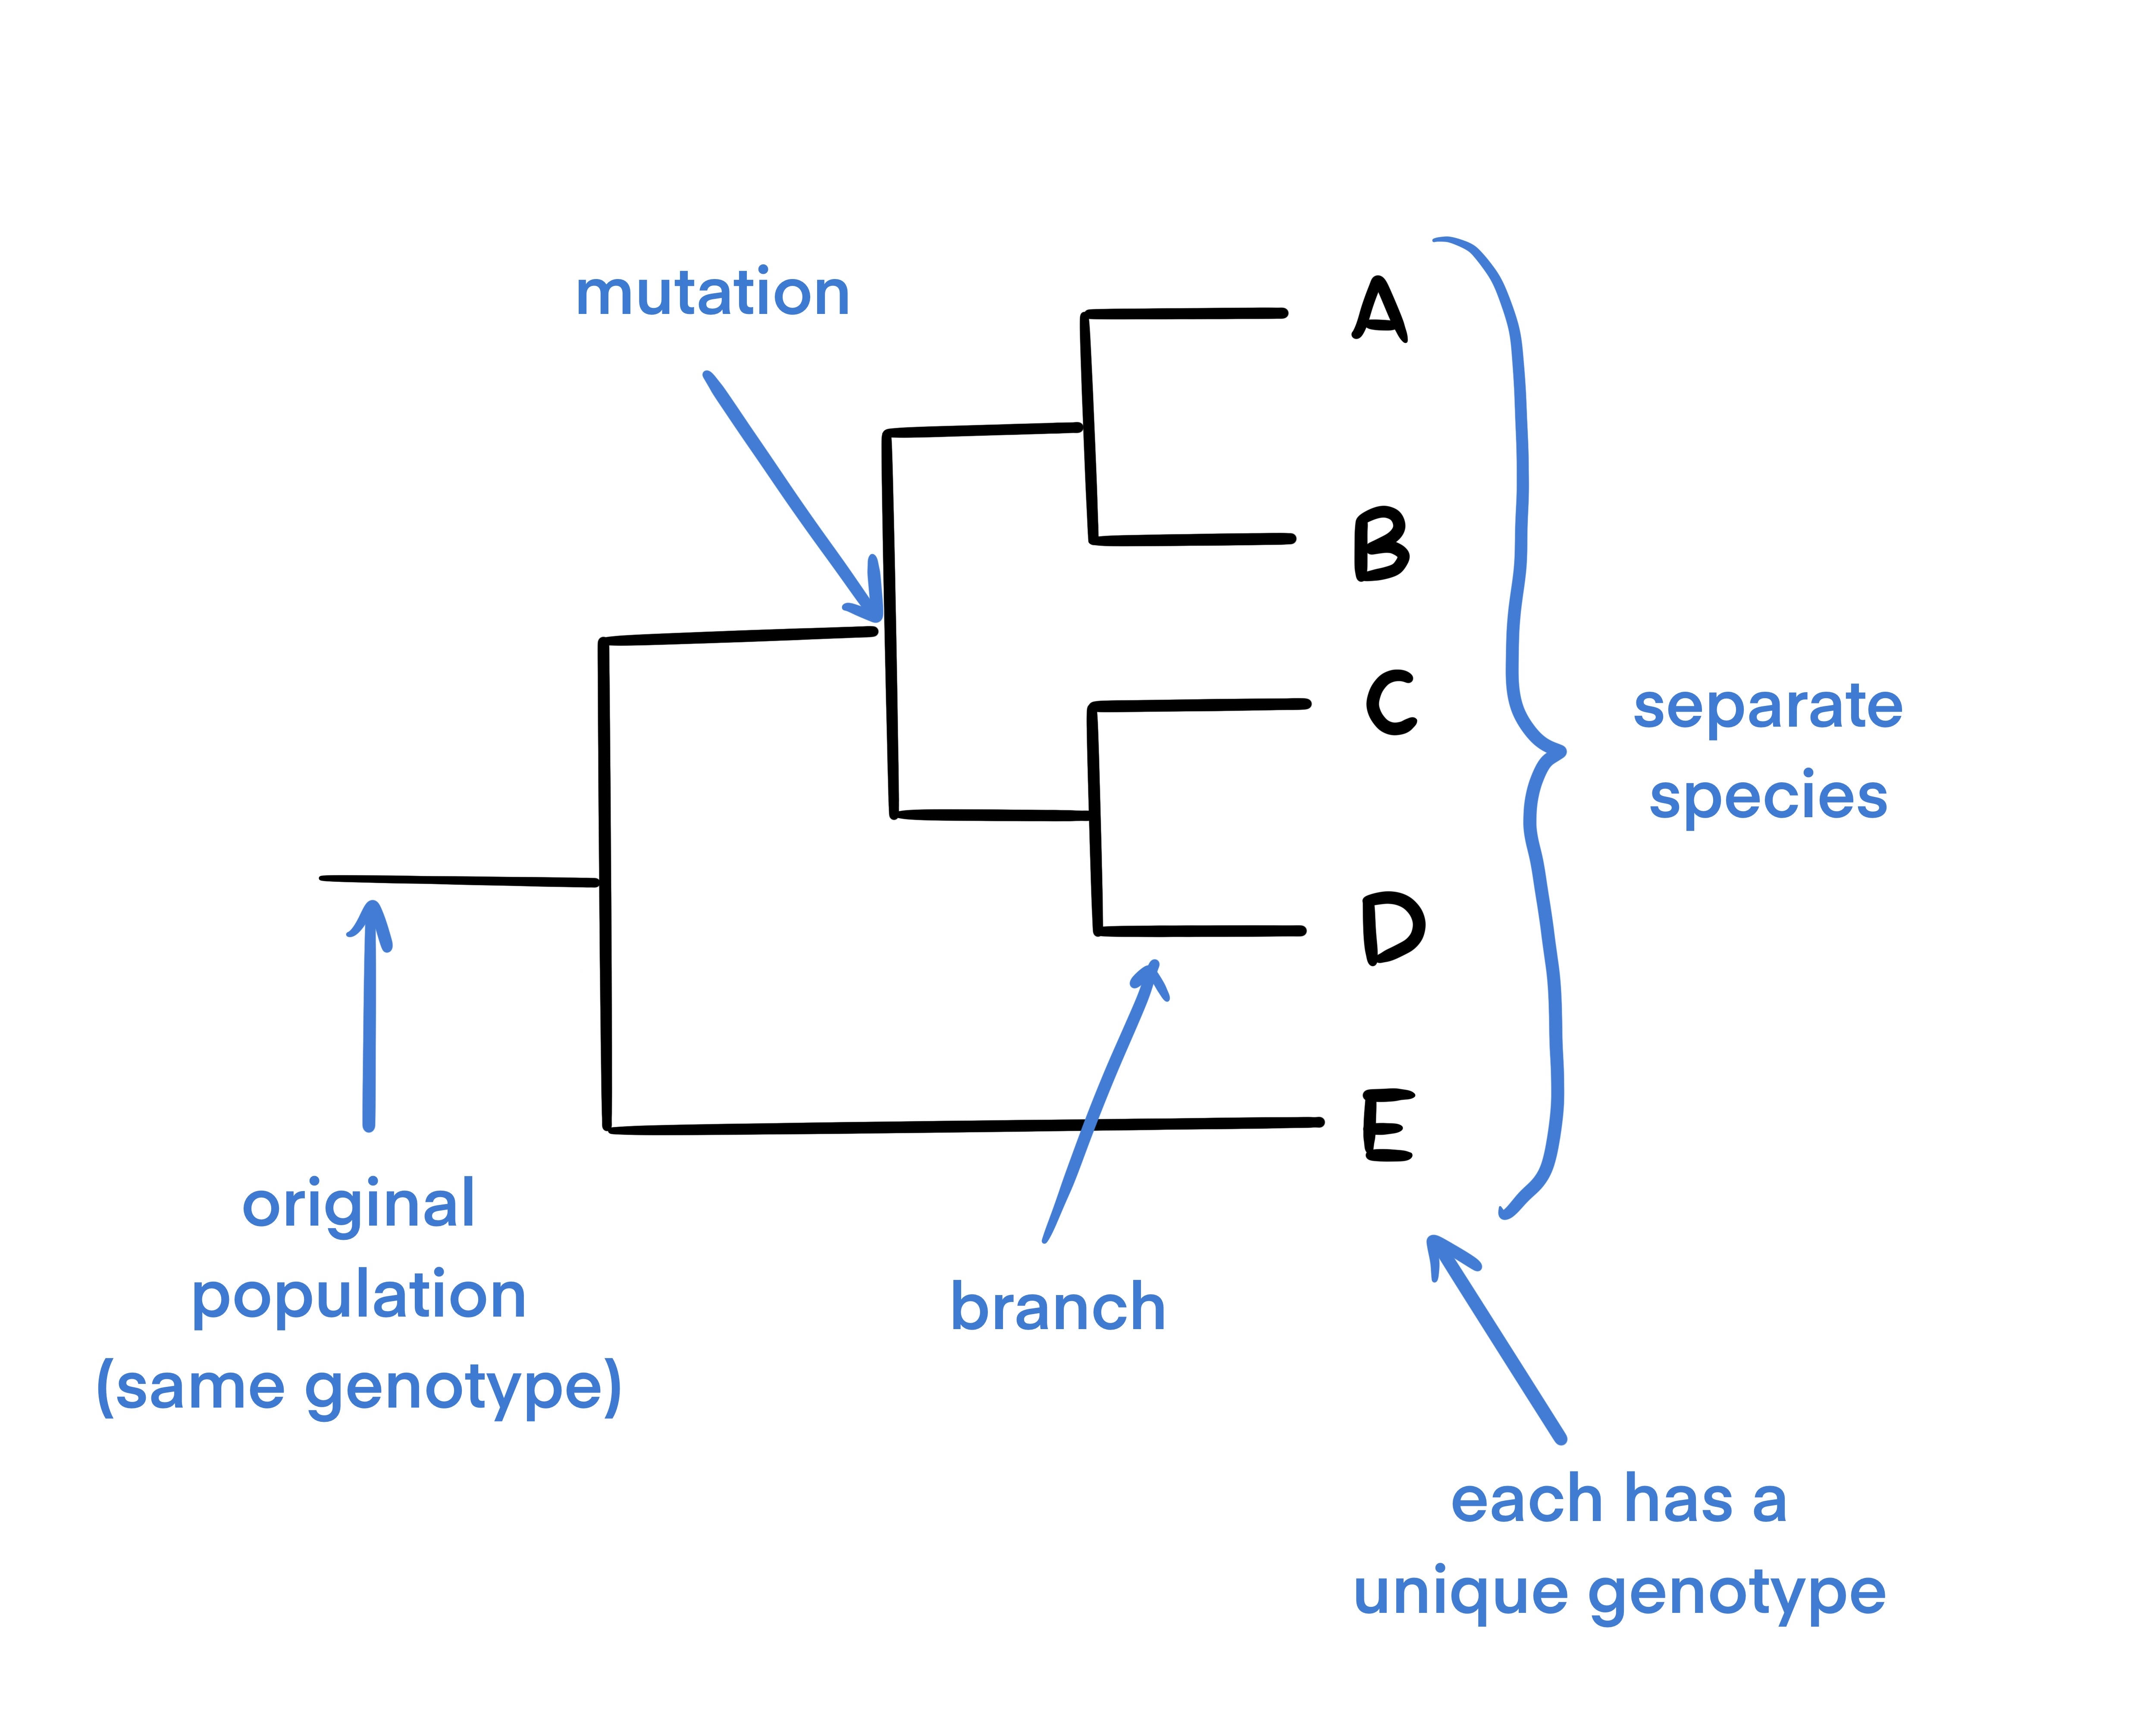
A phylogenetic tree is a commonly used abstraction or way of thinking about evolutionary relationships in biology. Phylogenetic trees are used to show evolutionary relationships between organisms. The tree begins with a single population and branches when a portion of the population mutates. Because of this, phylogenetic trees are a great way to show how various species have evolved from a single individual or group.
This is a diagram of a basic phylogenetic tree. In this diagram, the population mutated 4 times (as shown by each divergence of the tree at each node). The final 5 taxa at the end of the tree each have unique genotypes and are considered distinct from one another.
🔗 Null Models
A null model is a randomly generated model of an object or structure that is not constrained by its typical characteristics. It is instead based on the randomization of data and structure. A null model attempts to achieve the most unbiased model possible.
🔗 Phylogenetic Diversity
Phylogenetic diversity is a measure of biodiversity in a population or set of species. In this project, phylogenetic diversity is defined as the number of internal nodes in the tree plus the number of extant taxa, minus one. This metric assumes that all branches from parent to child have a length of one. Extant taxa are groups of organisms that are still present in the tree, and have not died out (become extinct).
In this project, phylogenetic diversity was used as the metric for comparison. Evolutionary distinctiveness could have also been used. However, phylogenetic diversity is a highly applicable trait among trees, and it is easy to calculate, making it a desirable metric for comparison.
🔗 Synchronous vs. Asynchronous Populations
A synchronous population is a population in which each generation is a discrete time point and a completely new set of individual organisms is created for each generation. This means that an organism and its parent can never exist at the same time.
An asynchronous population is the opposite, where generations overlap and organisms reproduce when they are ready.
This project exclusively uses synchronous populations.
🔗 Percentiles
A percentile is a range of values split into 100 equal groups. Each group corresponds to a number between 0 and 100, this value is known as the percentile.
You can find a percentile range by ordering your data from least to greatest. The 20th percentile would be all of the values in the first 20% of your data.
🔗 The Null Model
🔗 GitHub Null Model
Coming up with a null model of a tree was not the most intuitive, but we decided that having the most randomly generated model was the best option.
We randomized how organisms were selected and how the tree branched as a result.
The way that organisms were chosen for reproduction is shown here:
int chooseOrg(vector<Organism> ¤tGen, emp::Random &randNum){
parentNum = randNum.GetInt(size(currentGen)); //chooses random spot
return parentNum;
}
In the code above, the Empirical random number generator was utilized to ensure that results were actually random. First, a random number was generated based on the size of the parent generation. That spot in the array was then set as the parent of the next generation.
In the null model, each time a new organism was created, it represented its own clade or taxon to ensure maximum diversity.
🔗 Mutation and Pressure for Diversity
🔗 GitHub Pressure for Diversity and Mutation Model
🔗 Mutation
The trees we used for comparison were trees with mutations and pressure for diversity.
The mutation rate used for all of the trees was 0.05, which is a typical value for tree modeling within Empirical. In these models, each organism had a genotype as an attribute.
Mutation was determined randomly. The population generated in the first round of the tree all had a genotype of integer 0. A random double between 0 and 1 was generated with each creation of an organism following this generation. If the value generated was less than 0.05, the genotype would mutate. If a mutation was required, a new random number would be generated between -3 and 3. That genotype would then be subtracted from the original genotype.
For example, if the organism had a genotype of 2, and was chosen to mutate, and the mutated genotype generated was -3, the new genotype for that organism would be 2 - (-3), which is 5.
Mutations are also heritable, meaning that the child of an organism would inherit the same mutated or not mutated genotype as its parent. Once an organism mutated, it would create a branch in the tree.
The following code shows how the organism class handles mutations. In the model that just used mutations (no pressure for diversity), this code is used as the organism class.
class Organism {
public:
    int genotype = 0; //default genotype is 0

    Organism() {
    }

    Organism(int _genotype) { //genotype is inherited
        genotype = _genotype;
    }

    int MutateGenotype(emp::Random &RandNum) { //determines if genotype will mutate

        double randMutation = RandNum.GetDouble(0, 1);

        if (randMutation < mutRate) {
            int MutatedGenotype = genotype - RandNum.GetInt(-3, 3);
            genotype = MutatedGenotype;
            cout << "mutated genotype = " << genotype << endl;
        } else {
            cout << "not mutated genotype = " << genotype << endl;
        }

        return genotype;
    }
};
🔗 Pressure for Diversity
A goal of this project was to show that when we added a constraint that would incentivize the tree to branch more frequently, the overall diversity would increase. This goal arose from a need to show that our normalization technique could correctly and consistently identify situations in which there were selective pressures placed on the tree, unlike our mutated or null models. The way that this was accomplished was by adding a pressure for the tree to diversify by favoring rarer genotypes. Rarer genotypes are genotypes that are possessed by fewer organisms than other more common genotypes.
In the model that uses pressure for diversity and mutations, genotypes that are rarer are favored for reproduction over more common genotypes. When rarer genotypes are chosen, diversity increases throughout the tree. We referred to this as fitness which was calculated in the following code:
void calcFitness(vector<Organism> ¤tGen, vector<double> &fitnessVect, emp::Random &randNum) {
fitnessVect.resize(0);
vector<int> fitnessCalc;
fitnessCalc.reserve(currentGen.size());
for (int i = 0; i < currentGen.size(); i++) {
fitnessCalc.push_back(currentGen[i].genotype);
}
map<int, int> CountMap;
for (int j = 0; j < fitnessCalc.size(); j++) {
if (emp::Has(CountMap, fitnessCalc[j])) {
CountMap[fitnessCalc[j]]++;
} else {
CountMap[fitnessCalc[j]] = 1;
}
}
for(int k = 0; k < fitnessCalc.size(); k++){
fitnessVect.push_back(1.0/CountMap[fitnessCalc[k]]); //calculates fitness by using 1/genotype occurrence
}
}
After fitness was calculated, the organisms with rarer fitness were chosen for reproduction. For this, I used the following ChooseOrgDiversity function.
int chooseOrgDiversity(vector<double> &fitnessVect, emp::Random &randNum){
    emp::IndexMap fitness_index(fitnessVect.size());

    for (size_t id = 0; id < fitnessVect.size(); id++){
        fitness_index.Adjust(id, fitnessVect[id]);
    }

    const double fit_pos = randNum.GetDouble(fitness_index.GetWeight());
    size_t parent_id = fitness_index.Index(fit_pos);

    for(int pos = 0; pos < fitnessVect.size(); pos++){
        //cout << fitnessVect[pos] << " " << endl;
    }
    parentNum = parent_id;
    cout << "fitness val at parent_id: " << fitnessVect[parent_id] << endl;

    return parentNum;
}
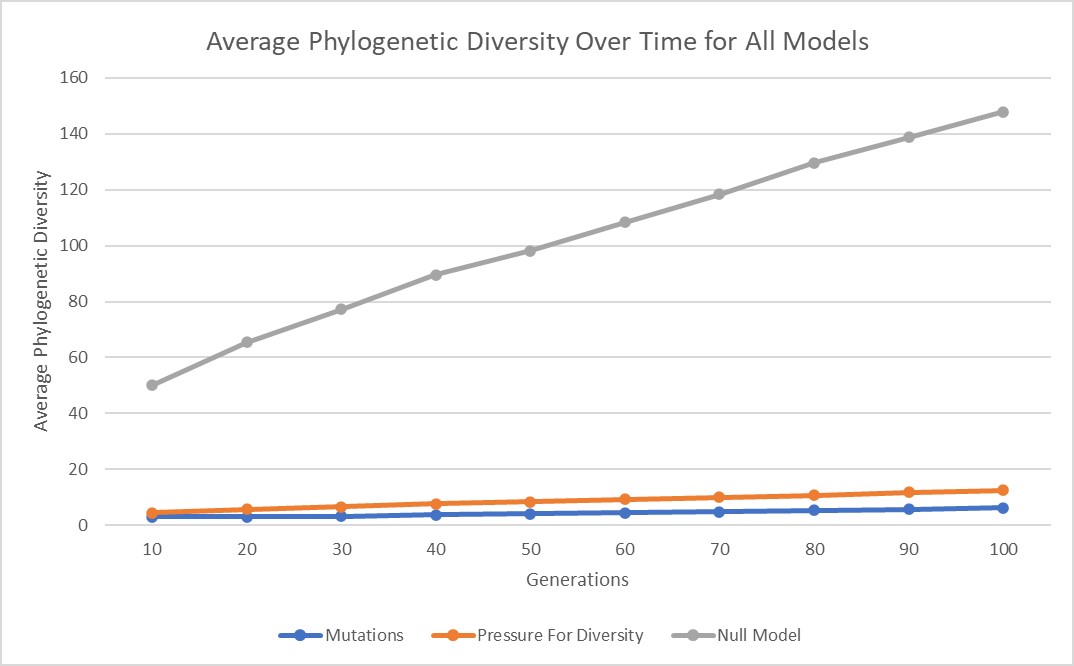
In all three of these models, phylogenetic diversity increases with tree depth (number of generations). This is very clearly illustrated in all 3 of my models and is shown in the graph below.
🔗 Systematics
Systematics.h is a file manager in Empirical. It is used to track genotypes, species, clades, or lineages of organisms. Systematics.h allows a user to create phylogenetic trees with various levels of abstraction by using genotypes, phenotypes, etc, to keep track of lineage.
This project focused on two topics – creating models to establish the possible range of phylogenetic diversity, then testing those models, and lastly, incorporating these percentiles into systematics so that a user could see how their own trees compare.
Within the systematics manager, I added two functions to use when calculating phylogenetic diversity and finding the percentile associated with that diversity.
The first function, FindPhyloData(), can be used if a user wants to compare results with the null model. It will calculate the phylogenetic diversity wherever the function is called and return the percentile corresponding to that value based on the data from the null model, which is stored in tree_percentiles.csv. However, if you use this particular function, you can’t choose the number of generations. This set of data also accounts for all of the possible phylogenetic diversity values that were found in the model, not just final values. This means there is data for 10 generations through 100 generations with no clear distinction.
tree_percentiles.csv contains data that looks like this:
The leftmost number refers to the percentile. The second number is the corresponding phylogenetic diversity value.
| Percentile | Diversity |
|---|---|
| 0 | 19 |
| 1 | 22.96 |
| 2 | 27 |
| 3 | 32 |
| … | |
| 98 | 160 |
| 99 | 168 |
| 100 | 201 |
  int FindPhyloData(){
    int percentile;

    emp::File tree_percentiles("tree_percentiles.csv"); //loading file

    emp::vector< emp::vector<double> > percentile_data = tree_percentiles.ToData<double>(','); //turns data into an array

     int PhyloDiversity = GetPhylogeneticDiversity();

    for (int i = 0; i < percentile_data.size() - 1; i++){

        if( (PhyloDiversity >= percentile_data[i][1]) && (PhyloDiversity < percentile_data[i + 1][1])){
           //std::cout << "Phylogenetic Diversity: " << PhyloDiversity << std::endl;
           //std::cout << "phylo diversity is in between: " << percentile_data[i][1] << " and " << percentile_data[i + 1][1] << std::endl;
           std::cout << PhyloDiversity << " is in percentile: " << percentile_data[i][0] << std::endl;

           percentile = percentile_data[i][0];

           std::cout << percentile << std::endl;
           }
      }
      return percentile;
    }
The following function, GetPhylogeneticDiversityNormalize(), can be used for trees that contain pressure for diversity, just mutations, or a random tree like the null model. It can also be used for multiple generations (10 through 100 generations). When called, it takes an argument for the number of generations and filename. This corresponds to a line in the specified csv, each containing percentiles for different numbers of generations. This function only allows users to use multiples of 10 for the generation numbers though. For example, 10, 20, 30, … 100 generations.
If this function is used with no arguments, it will only return the phylogenetic diversity value where it is called. If you want to find the percentile value associated with your phylogenetic diversity, you need to add two arguments – the number of generations in your tree and the filename that you want to compare with. If you want to receive a percentile value from the file without pressure for diversity, the filename argument should be replaced with "TensChooseOrgGenotype.csv". If you want to compare with pressure for diversity values, you can use TensChooseOrgDiversityGenotype.csv. If you want to compare with the null model and specify generations, you can use TensCladeMultiGen.csv. You can use any of these files, regardless of tree type.
  int GetPhylogeneticDiversityNormalize(int Generation = 0, std::string filename = ""){
    int GenValue = ((Generation / 10) - 1); //indexes from 0, 100 generations would correspond to the 10th line in the csv
    //int percentile;
    bool percentFound = false;
    int PhylogeneticDiversity = ancestor_taxa.size() + active_taxa.size() - 1;

    if(filename == ""){
      //std::cout << "Phylogenetic Diversity is " << PhylogeneticDiversity << std::endl;
      return PhylogeneticDiversity;
    } else{

      emp::File generation_percentiles(filename); //opens file
      emp::vector< emp::vector<double> >percentile_data = generation_percentiles.ToData<double>(','); //turns file contents into vector

          for(int j = 0; j <= percentile_data[GenValue].size() - 2; j++){ //searches through vector for slot where phylo diversity fits

          if((percentile_data[GenValue][j] <= PhylogeneticDiversity) && (percentile_data[GenValue][j + 1] > PhylogeneticDiversity)){
            std::cout << "phylogenetic diversity is in between: " << percentile_data[GenValue][j] << "and " << percentile_data[GenValue][j+1] << std::endl;
            std::cout << "The phylogenetic diversity value " << PhylogeneticDiversity << " is in the " << j << " percentile, in the " << ((GenValue + 1)* 10) << " generation" << std::endl;
            return j;

            percentFound = true;
          }
          if(percentFound == true){
            break;
          }
        }
      }
      return 100;
   }
🔗 Using this function:
- Call
GetPhylogeneticDiversityNormalize()in your tree-generating program. - Use an argument for the number of generations your tree has.
- Choose a file for comparison:
"TensChooseOrgGenotype.csv"orTensChooseOrgDiversityGenotype.csv. - Your function call should look something like this:
sys.GetPhylogeneticDiversityNormalize(10, "TensChooseOrgGenotype.csv");
🔗 Method
1. Collect data for each model 1000 times.
With each of the three models, I ran each one 1000 times for every 10 generations and collected the phylogenetic diversity values at the end of each run.
For example, I would set the number of generations in the null model to 10. Then, I would run it 1000 times and at the end of each run, record the final diversity. I would then do 20 generations and so forth, all the way through 100 generations.
No Pressure for Diversity Raw Data
Pressure for Diversity Raw Data
2. Create a percentile range for each model.
After the initial data collection, I took that data and ran it through a python script which created a percentile range. It did this by sorting all of the data from least to greatest. It would then take every 10th value in the dataset, to output 100 final diversity values, each corresponding to a percentile value from 0 to 100. For each of the different models, I repeated the same process.
Percentile Data No Pressure for Diversity
Percentile Data Pressure for Diversity
3. Incorporate percentile files into Systematics.h
To incorporate this data into the systematics manager, I imported the percentile csv files (output of the python script) into the two functions described in the systematics section. Wherever these functions are called in future code, they will calculate the phylogenetic diversity of the tree and return the percentile value for how the tree compares to the models.
4. Test Systematics classifications
After I had this framework setup I decided to test its reliability. I ran my models once again and had the systematics manager classify each tree’s final phylogenetic diversity after each set of generations. I used the file containing percentiles for the tree that used mutations but had no pressure for diversity.
When I used this process on the tree with mutations but with no pressure for diversity, I would expect to see values in the 50th percentile range. However, if repeated for the tree with pressure for diversity, I would then expect to see values significantly higher than the 50th percentile.
🔗 Results
The following table contains the percentile values for a tree with no pressure for diversity
| Average | Standard Deviation | |||||||||||
|---|---|---|---|---|---|---|---|---|---|---|---|---|
| 10 gens | 61 | 37 | 61 | 97 | 61 | 61 | 61 | 61 | 37 | 37 | 57.4 | 17.93320942 |
| 20 gens | 88 | 95 | 99 | 19 | 95 | 88 | 40 | 62 | 95 | 88 | 76.9 | 27.44064301 |
| 30 gens | 16 | 95 | 97 | 36 | 98 | 95 | 87 | 36 | 75 | 57 | 69.2 | 30.67318771 |
| 40 gens | 11 | 90 | 68 | 11 | 94 | 81 | 90 | 11 | 50 | 11 | 51.7 | 37.23215456 |
| 50 gens | 6 | 74 | 58 | 58 | 97 | 39 | 93 | 39 | 74 | 20 | 55.8 | 29.96219841 |
| 60 gens | 16 | 90 | 31 | 68 | 50 | 31 | 98 | 68 | 50 | 68 | 57 | 26.38181192 |
| 70 gens | 26 | 93 | 26 | 26 | 43 | 61 | 93 | 13 | 61 | 13 | 45.5 | 30.28109054 |
| 80 gens | 69 | 81 | 20 | 36 | 69 | 69 | 98 | 9 | 69 | 20 | 54 | 30.23243292 |
| 90 gens | 17 | 61 | 17 | 31 | 75 | 61 | 96 | 47 | 61 | 47 | 51.3 | 25.04240847 |
| 100 gens | 12 | 70 | 1 | 39 | 39 | 56 | 98 | 25 | 70 | 39 | 44.9 | 29.27437256 |
The table below contains the percentile values for a tree with pressure for diversity.
| Average | Standard Deviation | |||||||||||
|---|---|---|---|---|---|---|---|---|---|---|---|---|
| 10 gens | 37 | 80 | 80 | 61 | 99 | 61 | 98 | 91 | 61 | 91 | 75.9 | 20.2509259 |
| 20 gens | 62 | 77 | 98 | 95 | 99 | 88 | 99 | 77 | 77 | 98 | 87 | 12.99572579 |
| 30 gens | 57 | 95 | 98 | 98 | 97 | 97 | 99 | 95 | 95 | 97 | 92.8 | 12.65613597 |
| 40 gens | 100 | 94 | 99 | 90 | 97 | 97 | 100 | 97 | 97 | 100 | 97.1 | 3.142893218 |
| 50 gens | 97 | 74 | 100 | 93 | 100 | 99 | 93 | 97 | 99 | 100 | 95.2 | 7.913420387 |
| 60 gens | 99 | 95 | 95 | 100 | 99 | 98 | 98 | 95 | 99 | 100 | 97.8 | 2.043961296 |
| 70 gens | 99 | 99 | 93 | 100 | 99 | 99 | 99 | 99 | 99 | 100 | 98.6 | 2.011080417 |
| 80 gens | 99 | 95 | 99 | 98 | 99 | 100 | 81 | 100 | 100 | 99 | 97 | 5.811865258 |
| 90 gens | 99 | 96 | 99 | 99 | 98 | 98 | 86 | 99 | 99 | 99 | 97.2 | 4.049691346 |
| 100 gens | 99 | 99 | 99 | 99 | 98 | 99 | 94 | 99 | 99 | 99 | 98.4 | 1.577621275 |
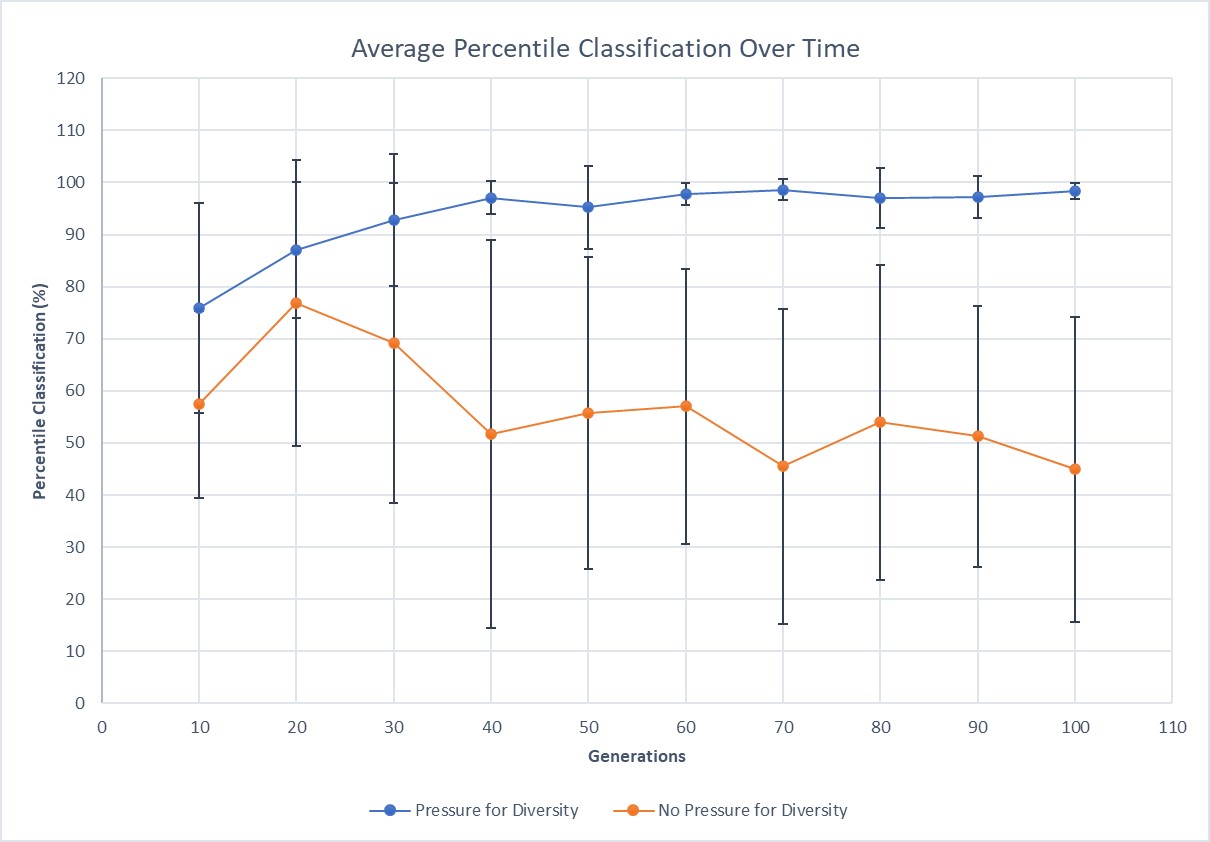
This graph displays the average percentile classification and the standard deviation for each point (the error bars).
These tables and graph show that the tree with no pressure for diversity outputs values that average at 56.37, around what we would expect for this model. The trees with pressure for diversity, regardless of tree depth, also average at 93.7, which is very close to the expected outcome. These results illustrate that the percentile data collected can be used to classify future trees.
🔗 Conclusion
Based on the results shown above, the current function in the systematics manager, GetPhylogeneticDiversityNormalize(), is able to correct for the effect of tree size and return the percentile value of a given tree.
Considering the size of this project, the standard deviation observed in our findings does not raise much concern for validity. The results seen, being that tree with no pressure for diversity result in an average classification of 56.37 and trees with pressure to diversify have an average classification of 93.7, we can conclude that this function provides a useful classification of phylogenetic trees.
If I were to continue this. I would write several more tests to improve the validity of these findings. I would also find percentile classifications for a much larger sample size for a more accurate data set.
This workshop was an incredible learning experience for me and I am very excited that I was able to generate meaningful data and tools for the Empirical library. I came into this workshop looking to improve my scientific computing and programming skills, and I can safely say that this workshop has provided me with a unique and invaluable way to do so. I am so grateful to my mentors, Emily and Kate, for their patience and guidance throughout this process. Thank you to the entire WAVES team for their flexibility and commitment to this program and to their participants, especially in such an unprecedented situation. Thank you WAVES for such an incredible opportunity!