WAVES Workshop Learning Outcomes
Mirroring the modernization of medicine and agriculture, critical, evidence-driven assessment has proven a key unifying element to guide improvement to educational practice (Davies, 1999). In particular, the difficulty and subtlety of persistent social inequalities within STEM education suggests a crucial role for empirical study in their remedy (Ballen et al., 2017; Theobald et al., 2020).
Evidence-driven assessment can fulfill an additional role, too, in demonstrating the efficacy of existing educational practice to stakeholders (Groccia and Buskist, 2011).
In these veins, we used entry and exit surveys assess participant outcoes from the 2020 and 2021 Workshop for Avida-ED Software Development (WAVES) program. We find significant improvements in participants’ self-reported proficiencies with C++, JavaScript, and HTML/CSS over the course of the workshop, with members of underadvantaged groups in computer science generally starting at a lower self-reported proficiency but gaining more proficiency during the workshop than their peers. Interestingly, we also observed a higher proportion of underadvantaged students report themselves as “very satisfied” with the workshop compared to their peers. However, among all participants, we did not observe improvements in participants’ self-reported overall programming proficiency nor their proficiency in evolutionary thinking.
🔗 Workshop Recap
The WAVES program was a series of two ten-week fully-remote, fully-funded focused on early-career research and software development offered in 2020 and 2021. Workshop curriculum centered around on independent work on a mentored software engineering or other research project. However, the workshop also included an intensive first-week tutorial series on technologies for deploying scientific software into the web browser (Emscripten and Empirical), weekly professional development enrichment seminars, and weekly all-hands check-in meetings.
The goal of the workshop was four-fold:
- to help participants advance their careers by skillbuilding through hands-on C++ and/or JavaScript software development in an academic setting,
- to catalyze effective science communication and science pedagogy by helping participants develop the know-how to showcase their research through interactive web applications,
- to jumpstart software development on web framework and core digital evolution tools in support of the next version of the Avida-ED scientific and educational software, and
- to produce software that broadly enriches the digital evolution, scientific, education, and open-source communities.
Objectives 3 and 4 are directly geared towards participants’ project artifacts themselves (i.e., software, documentation, blog posts, etc.). However, by their very nature, assessing the workshop’s success in reaching objectives 1 and 2 requires measuring participants’ learning. In order to facilitate summative assessment of participant learning outcomes (Dixson and Worrell, 2016), we performed a pre- and post-workshop electronic surveys of all participants.
🔗 Workshop Demographics
The workshop hosted 27 total participants (17 in 2020 and 10 in 2021). In 2020, 15 participants were undergraduates, 1 participant was a graduate student, and 1 workshop participant was a postdoc. In 2021, 9 participants were undergraduates and 1 participant was a graduate student.
In 2020, ten participants identified as women (59%). Seven participants identified as men (41%). Three participants (18%) identified as of Hispanic, Latino, or Spanish Origin. Three participants identified as Black or African-American (18%), one identified as Asian Indian (6%), two identified as Chinese (12%), and twelve identified as White (71%). One participant identified as a first-generation college student (6%).
Five participants identified as women (50%). Five participants identified as men (50%). One participant identified as Korean (10%), one identified as Vietnamese (10%), two identified as Other Asian (20%), and eight identified as White (80%). Three participants identified as LGBTQIAP (30%). One participant identified as first-generation (10%).
In line with the NSF, we considered participants who self-identified as women, African Americans, Hispanics, American Indians, Alaska Natives, Native Hawaiians, and Pacific Islanders as members of an underadvantaged group in computer science. Although it was not directly queried in our surveys, we considered participants who reported LGBTQIAP+ identity as “Other Identity” as members of an underadvantaged group, as well (Dym et al., 2021; Stout and Wright, 2016). Disability was also not directly queried in our surveys, and we didn’t have any participants report a disability identity as “Other Identity.”
We counted 21 of 27 (77%) workshop participants as members of an underadvantaged group (14/17 or 82% in 2020 and 7/10 or 70% in 2021). Because of anonymity concerns due to the small sample size, we do not disaggregate analyses beyond participants’ membership in an underadvantaged group (Bhatti, 2021).
🔗 C++, JavaScript, and HTML/CSS Proficiencies
In pre- and post-workshop surveys, we asked participants to rate their proficiency with C++, JavaScript, and HTML/CSS using the following scale (with $x$ substituted for C++, JavaScript, then HTML/CSS).
How comfortable are you with $x$?
- I have not used the language
- I have minimally used this language and/or I have not yet applied it to a project
- I have some experience with this language and am ready to tackle larger projects in it
- I have completed substantial, independent projects using this language
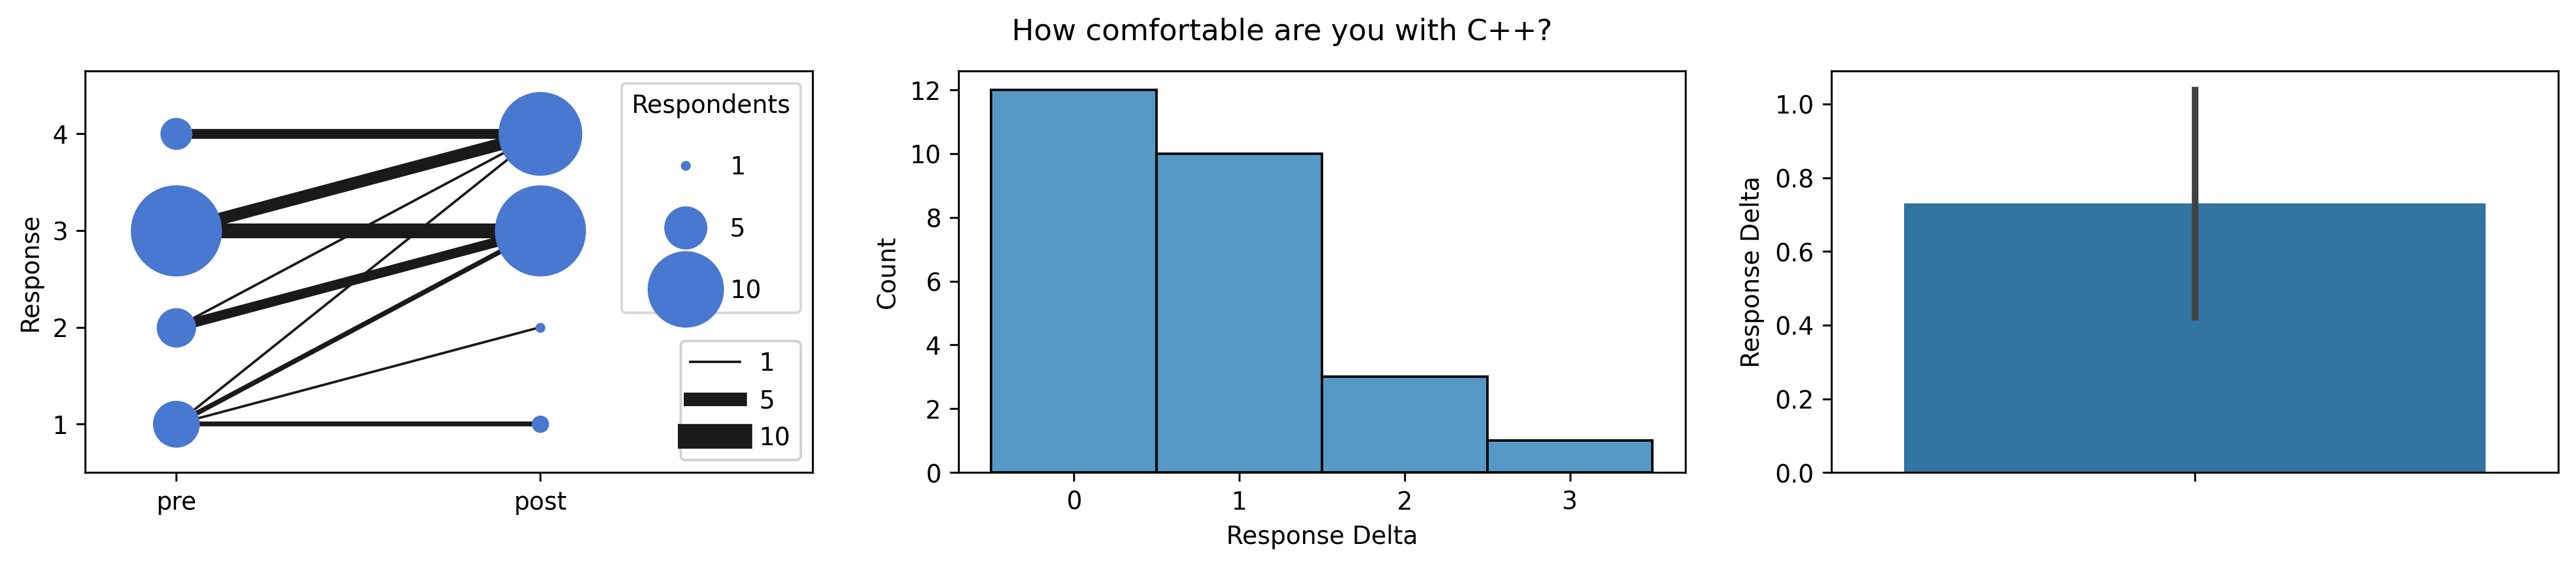 Figure SRPCP.
Self-reported participant C++ proficiency measured on workshop entry and exit survey.
Error bar denotes bootstrapped 95% confidence interval.
Figure SRPCP.
Self-reported participant C++ proficiency measured on workshop entry and exit survey.
Error bar denotes bootstrapped 95% confidence interval.
Figure SRPCP summarizes self-reported C++ proficiency before and after the workshop. More than half of participants rated themselves as more proficient at C++ after the workshop ended compared to when it began. Self-reported C++ proficiency increased significantly a mean of around 0.75 proficiency levels (strictly positive 95% confidence interval).
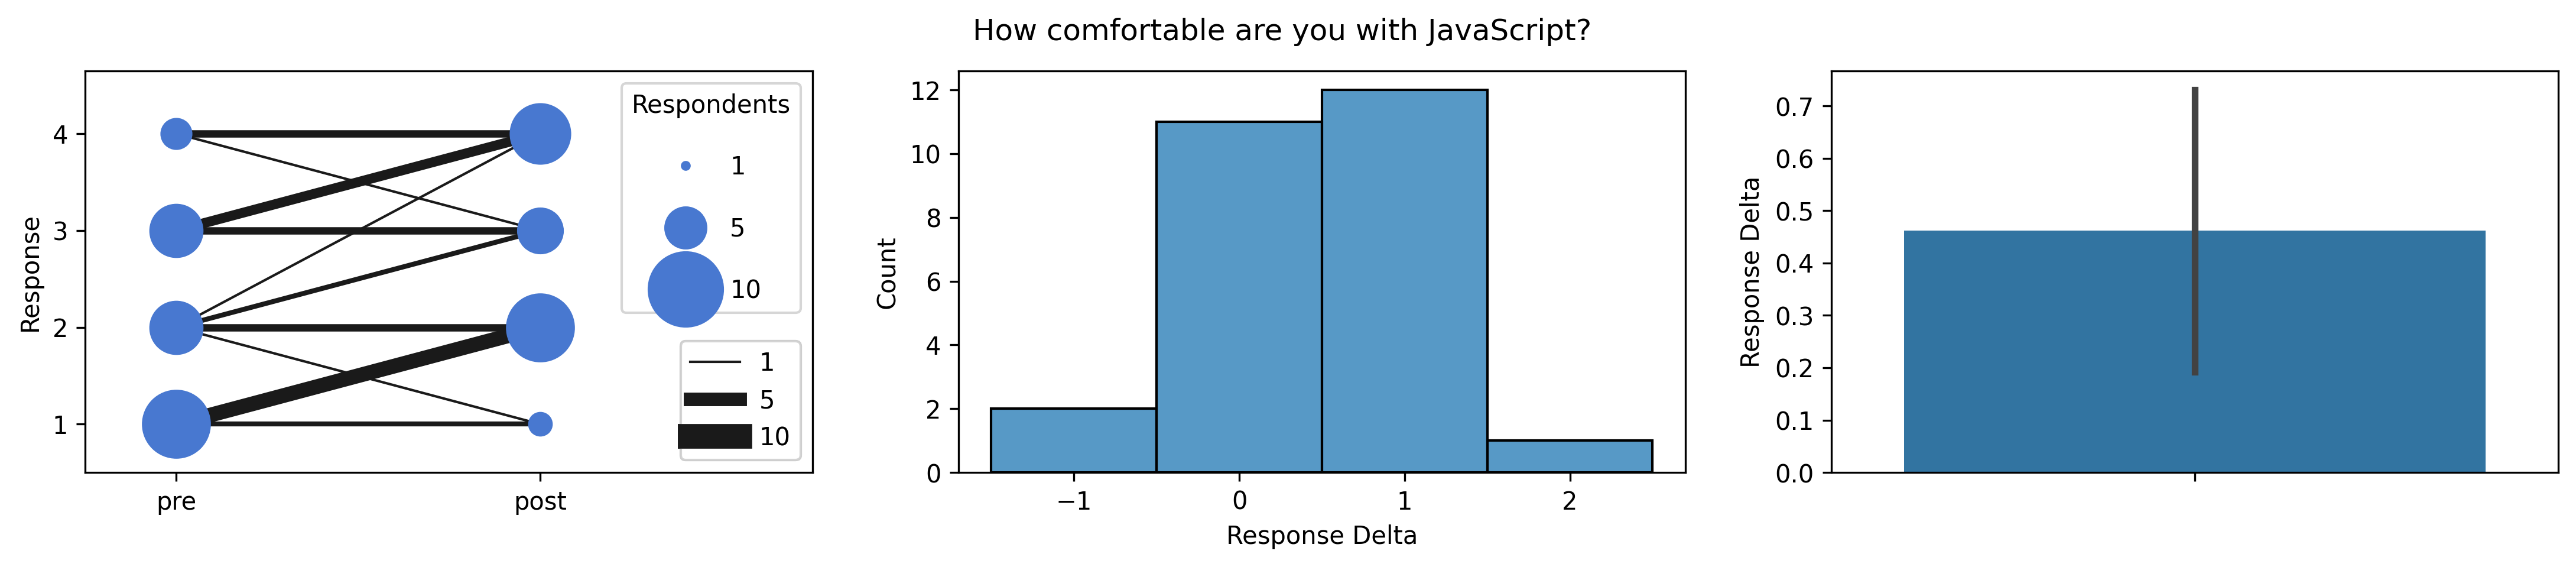 Figure SRPJP.
Self-reported participant JavaScript proficiency measured on workshop entry and exit survey.
Error bar denotes bootstrapped 95% confidence interval.
Figure SRPJP.
Self-reported participant JavaScript proficiency measured on workshop entry and exit survey.
Error bar denotes bootstrapped 95% confidence interval.
Figure SRPJP summarizes self-reported JavaScript proficiency before and after the workshop. About half of participants rated themselves as more proficient at JavaScript after the workshop ended compared to when it began. Two reported themselves less proficient. Self-reported JavaScript proficiency increased significantly a mean of around 0.45 proficiency levels (strictly positive 95% confidence interval).
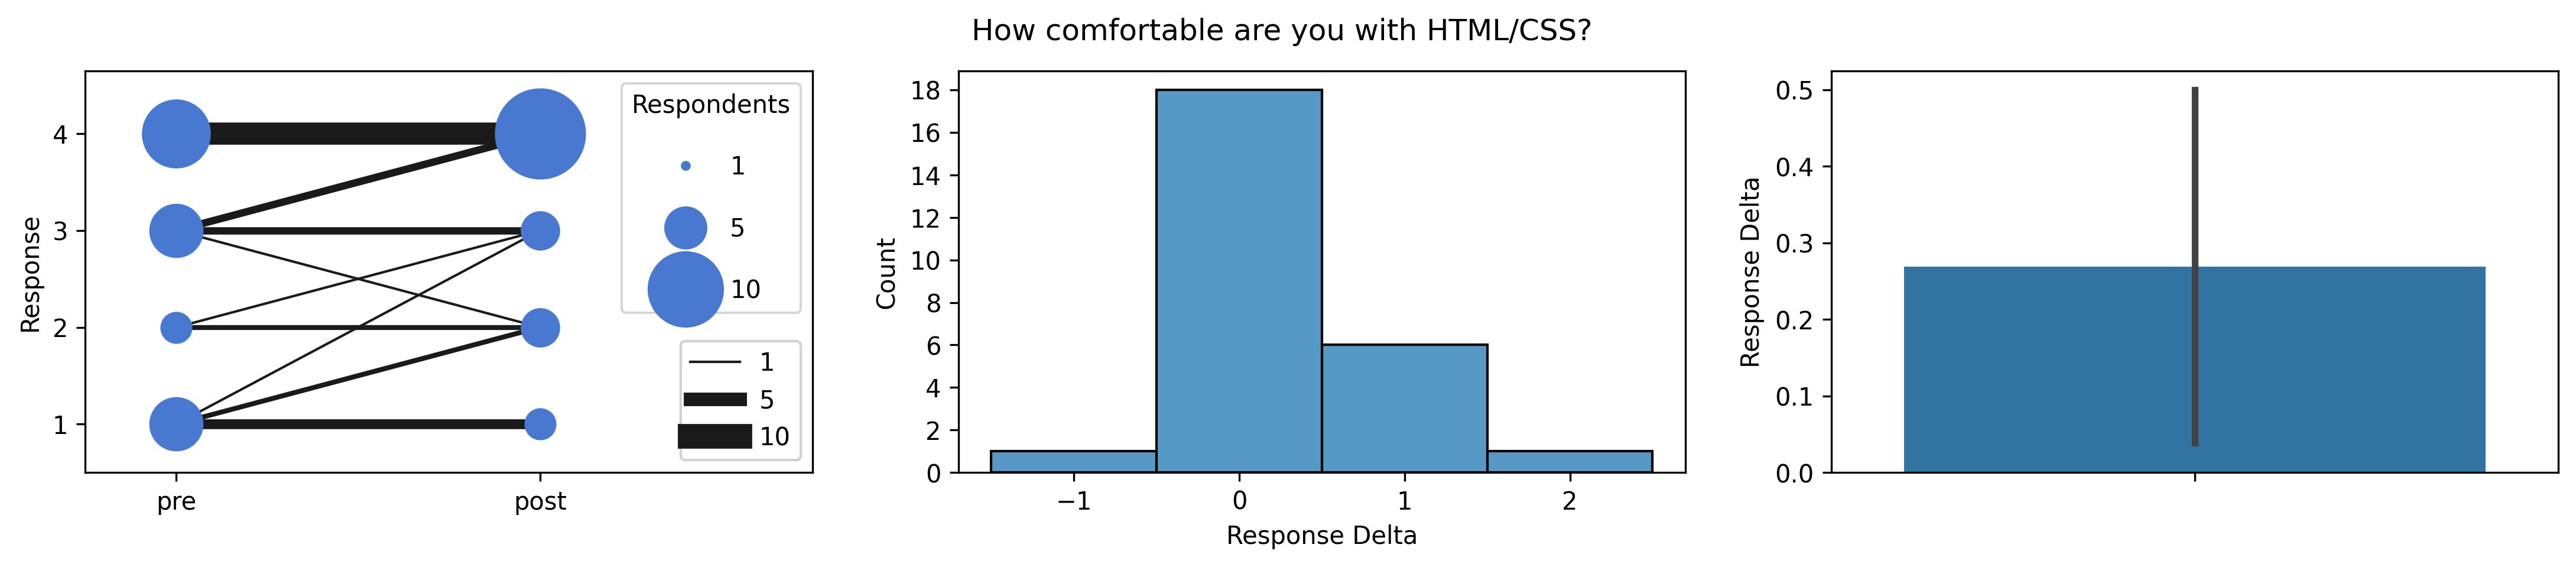 Figure SRPHP.
Self-reported participant HTML/CSS proficiency measured on workshop entry and exit survey.
Error bar denotes bootstrapped 95% confidence interval.
Figure SRPHP.
Self-reported participant HTML/CSS proficiency measured on workshop entry and exit survey.
Error bar denotes bootstrapped 95% confidence interval.
Figure SRPHP summarizes self-reported HTML/CSS proficiency before and after the workshop. About half of participants rated themselves as more proficient at JavaScript after the workshop ended compared to when it began. One reported themself less proficient. Self-reported JavaScript proficiency increased significantly a mean of around 0.25 proficiency levels (strictly positive 95% confidence interval).
🔗 C++, JavaScript, and HTML/CSS Proficiencies in Members of Underadvantaged Groups
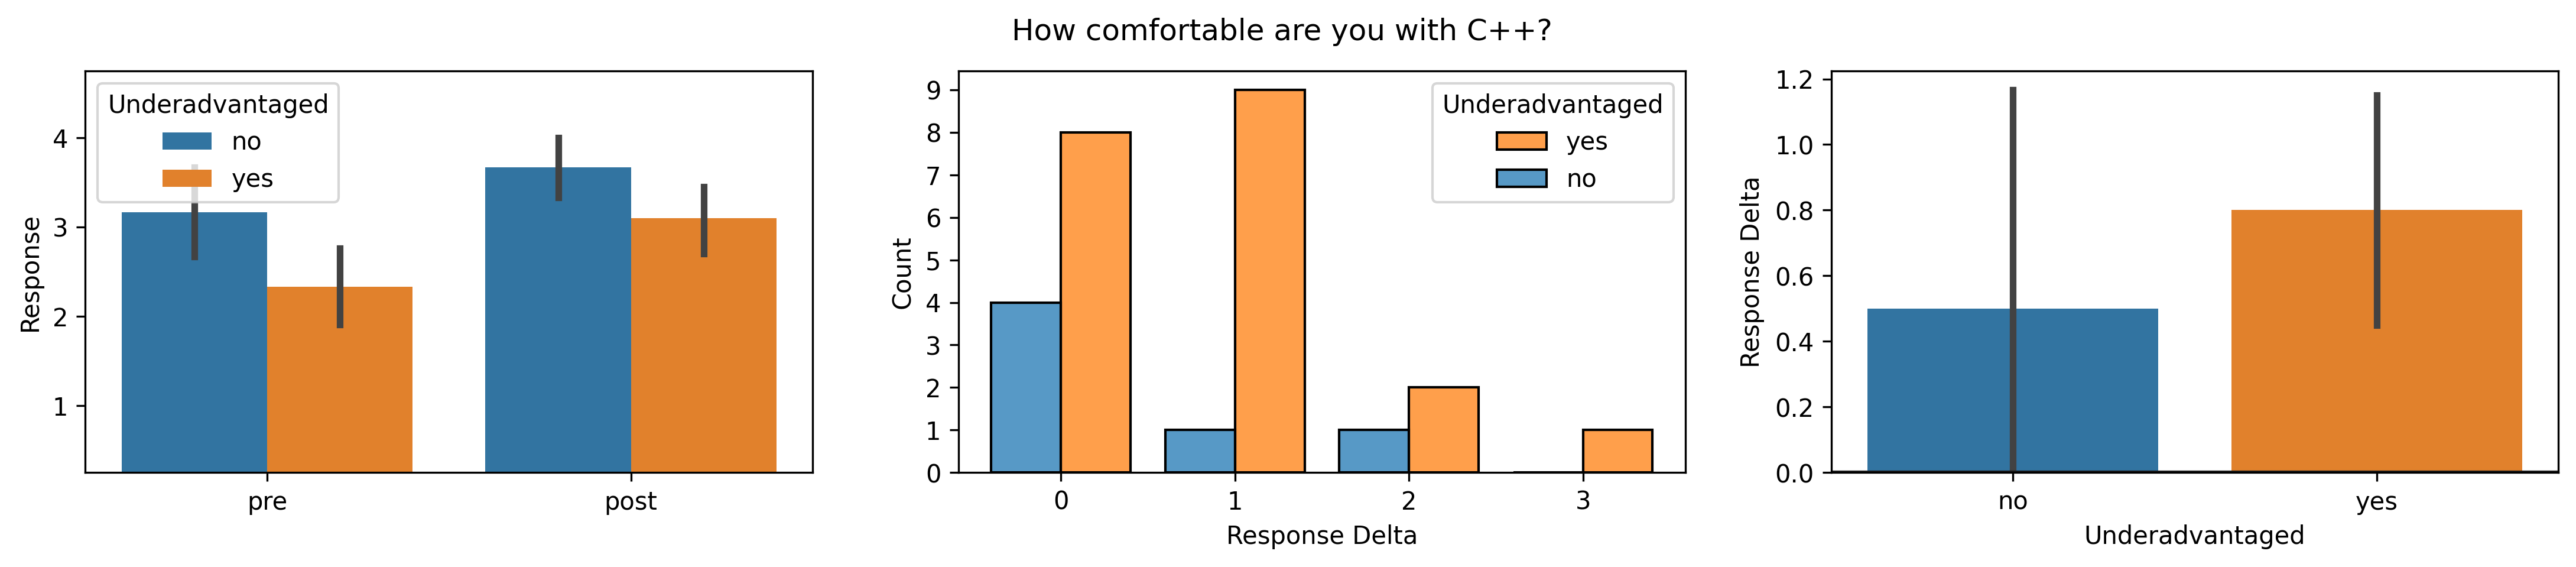 Figure DSRPC.
Disaggregated self-reported participant C++ proficiency measured on workshop entry and exit survey.
Error bar denotes bootstrapped 95% confidence interval.
Figure DSRPC.
Disaggregated self-reported participant C++ proficiency measured on workshop entry and exit survey.
Error bar denotes bootstrapped 95% confidence interval.
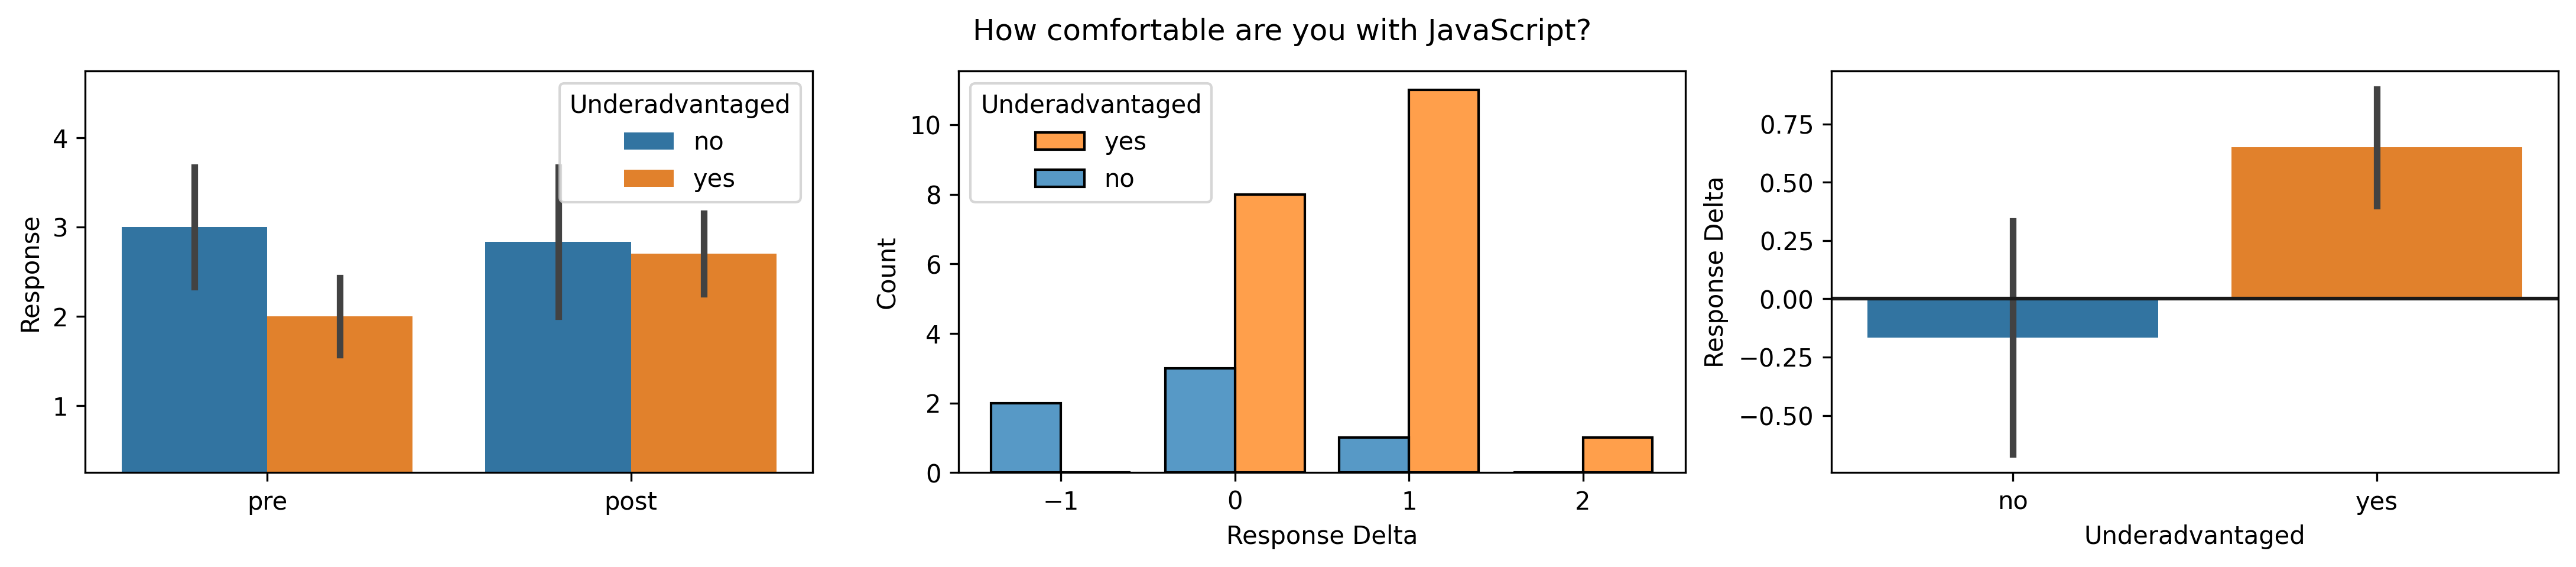 Figure DSRPJ.
Disaggregated self-reported participant JavaScript proficiency measured on workshop entry and exit survey.
Error bar denotes bootstrapped 95% confidence interval.
Figure DSRPJ.
Disaggregated self-reported participant JavaScript proficiency measured on workshop entry and exit survey.
Error bar denotes bootstrapped 95% confidence interval.
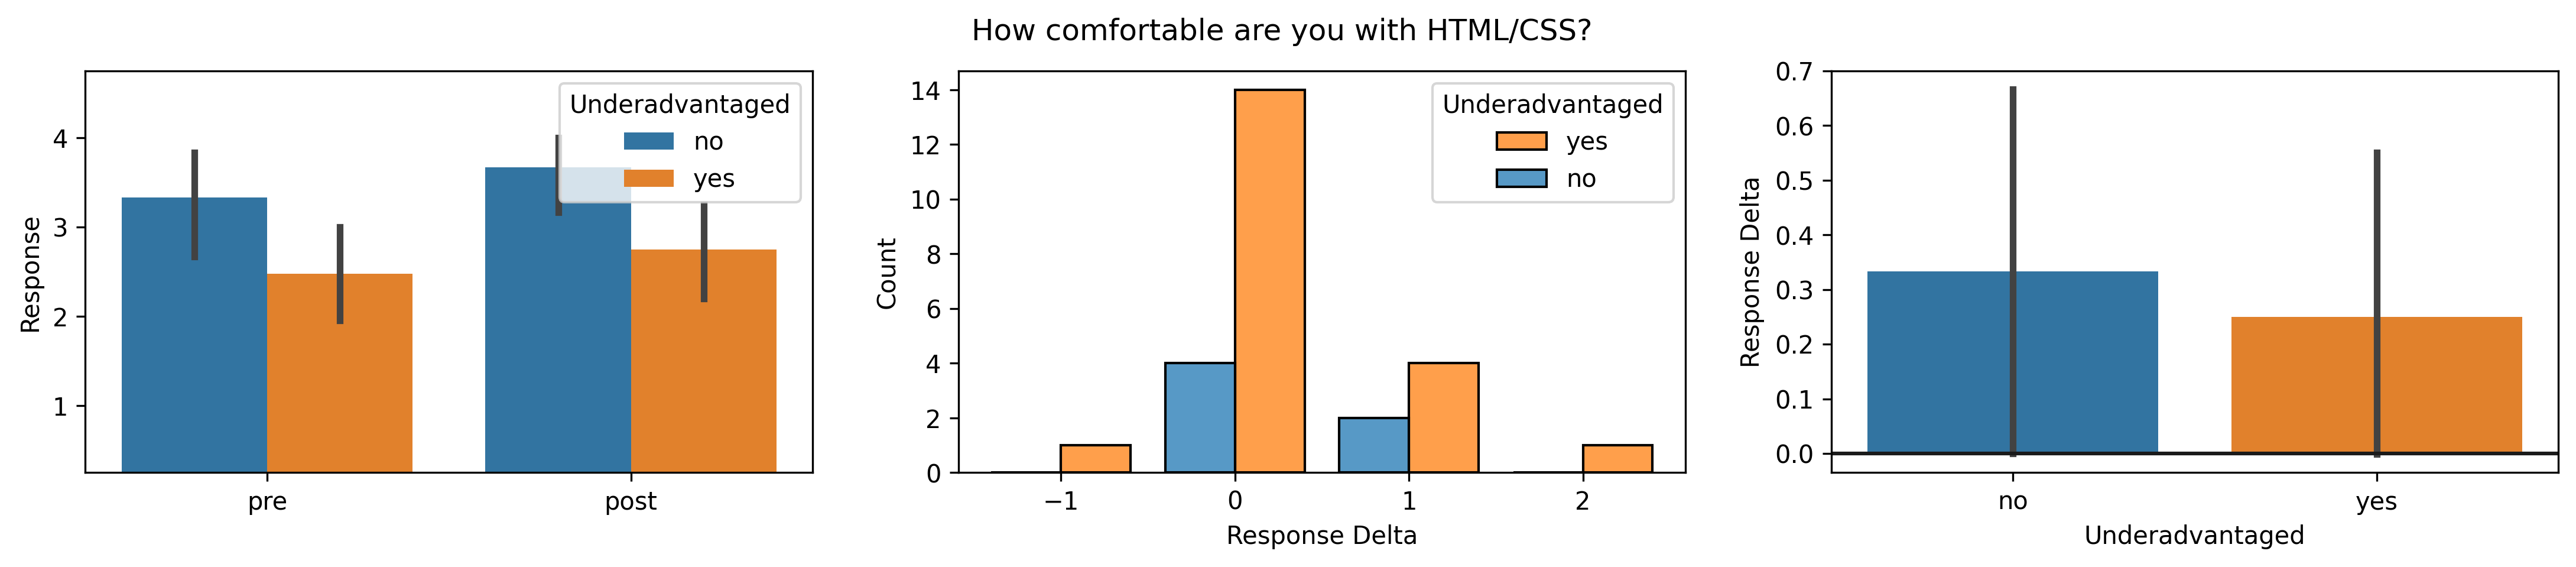 Figure DSRPH.
Disaggregated self-reported participant HTML/CSS proficiency measured on workshop entry and exit survey.
Error bar denotes bootstrapped 95% confidence interval.
Figure DSRPH.
Disaggregated self-reported participant HTML/CSS proficiency measured on workshop entry and exit survey.
Error bar denotes bootstrapped 95% confidence interval.
Figures DSRPC, DSRPJ, and DSRPH disaggregate members of underadvantaged groups’ self-reported proficiencies on C++, JavaScript, and HTML/CSS. For all three languages, these members entered and exited the workshop with on-average lower self-rated proficiency. However, for C++ and JavaScript members of underadvantaged groups gained on average more self-reported proficiency units, potentially representing success of the workshop in “catching up” these participants.
Although some comparisons might appear significant due to non-overlapping 95% confidence intervals, sample size is too small to reliably interpret the bootstrapped bars. The effect of some participants entering with no room for detectable improvement (i.e., rating themselves the highest available proficiency) must also be considered when interpreting results.
🔗 Programming Proficiency
In addition to asking about specific programming languages, we also asked participants to report their overall programming skill.
Which describes your overall level of proficiency with programming?
- I have no experience with programming
- I have some exposure to programming (e.g., coursework that used some programming or online programming tutorials)
- I have completed an introductory-level programming sequence (e.g., at least 1 year of programming courses)
- I have programmed large projects (e.g., a capstone to a CS degree, substantial on the job training, or large personal projects)
- I have done extensive programming work (e.g., a full time job for multiple years, or many years of personal projects)
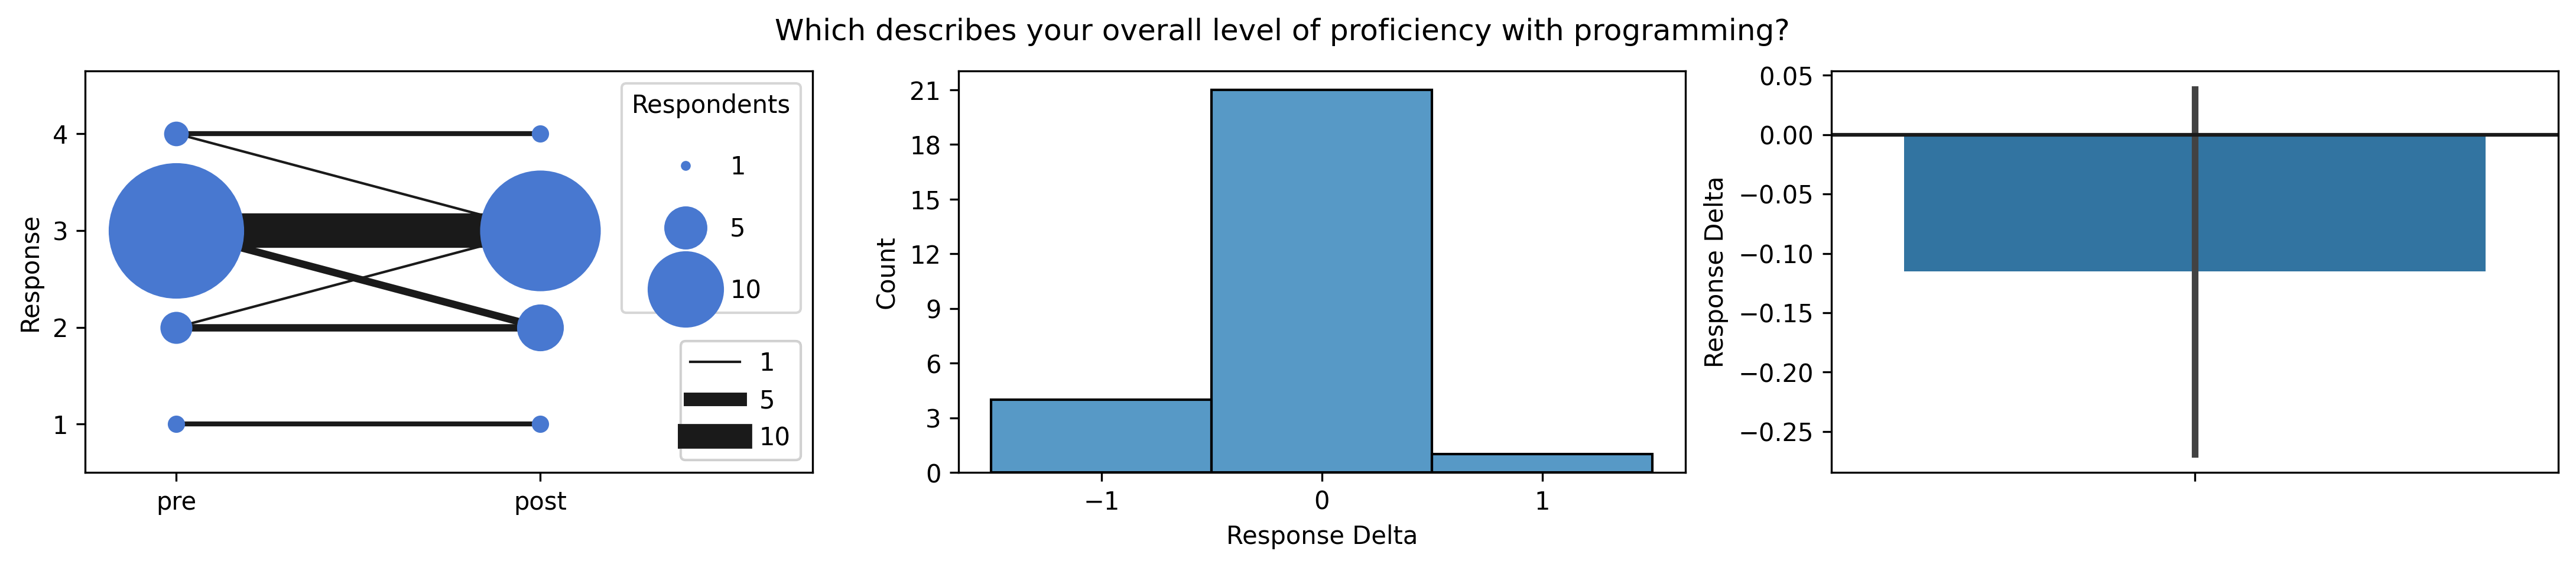 Figure SRPPM.
Self-reported programming proficiency measured on workshop entry and exit surveys.
Error bar denotes bootstrapped 95% confidence interval.
Figure SRPPM.
Self-reported programming proficiency measured on workshop entry and exit surveys.
Error bar denotes bootstrapped 95% confidence interval.
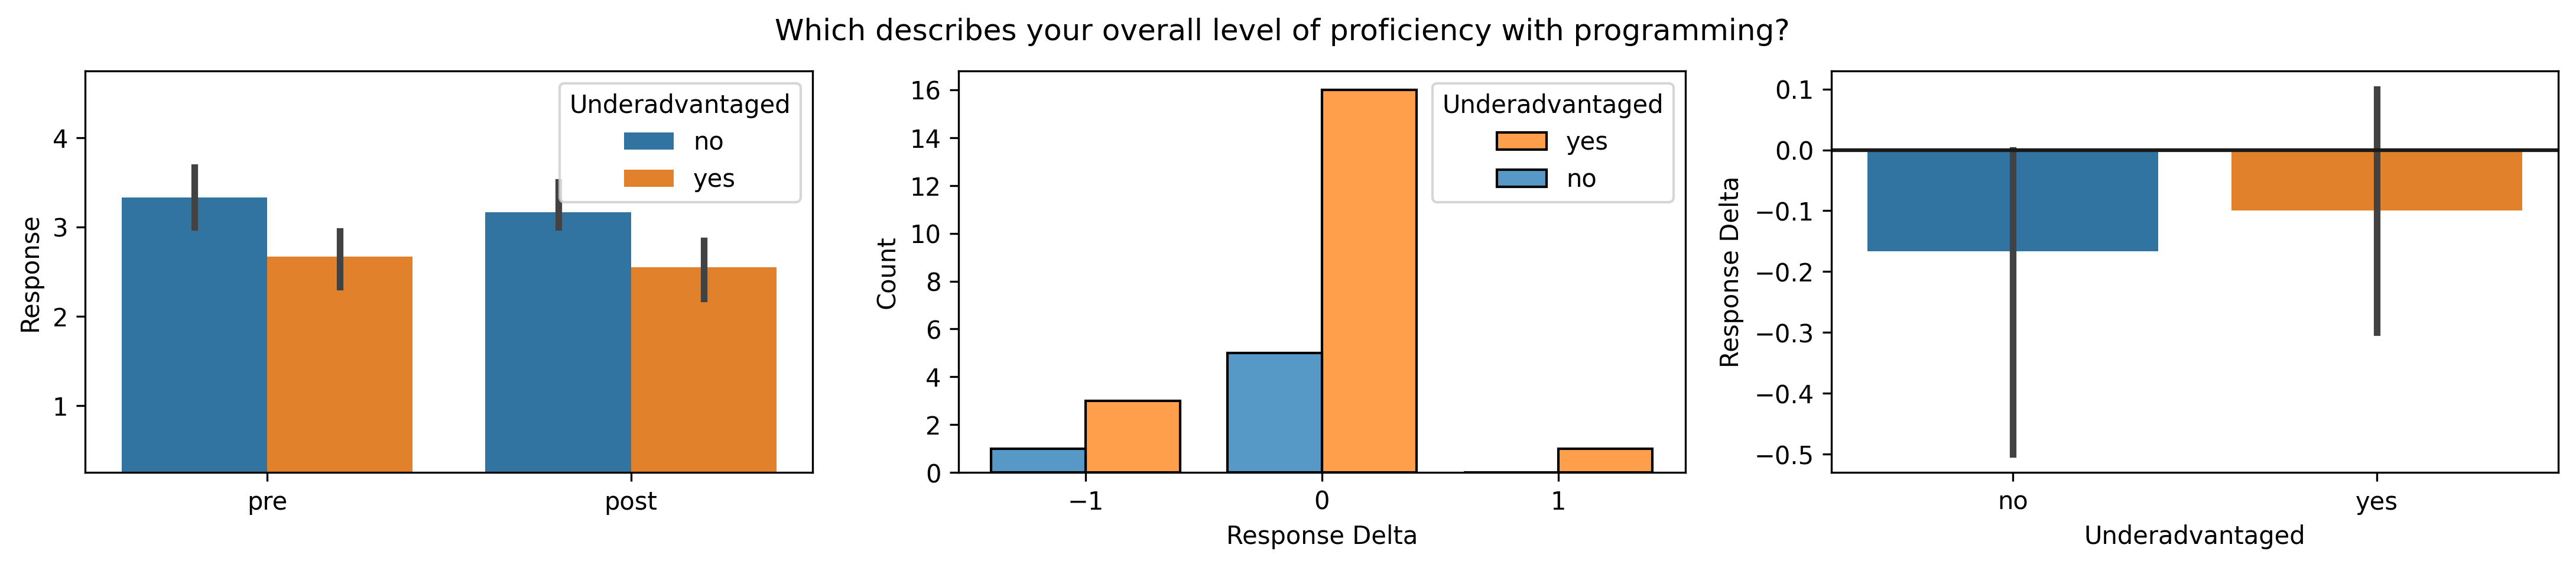 Figure DSRPP.
Disaggregated self-reported programming proficiency measured on workshop entry and exit surveys.
Error bars denotes bootstrapped 95% confidence interval.
Figure DSRPP.
Disaggregated self-reported programming proficiency measured on workshop entry and exit surveys.
Error bars denotes bootstrapped 95% confidence interval.
As shown in Figure SRPPM, we did not observe increases in self-rated overall proficiency in programming associated with WAVES. In fact, mean self-rated proficiency decreased over the course of the workshop. Figure DSRPP shows that status as a member of an underadvantaged group did not notably affect overall programming proficiency outcome. This result suggests that enrichment content on more general programming topics might benefit the workshop experience. However, this result might potentially be due to too-coarse and overly-career-oriented design of the response options.
🔗 Evolution Proficiency
Because of the evolution education mission of Avida-ED, we had participants reported their proficiency with evolutionary thinking according to the following scale.
How comfortable are you with evolutionary biology?
- I am unfamiliar with the fundamental mechanisms of evolution
- I am familiar with the fundamental mechanisms of evolution
- I am interested in open questions about evolution
- I feel comfortable engaging with talks and papers about contemporary evolution research
- I feel comfortable creating hypotheses based on evolutionary thinking
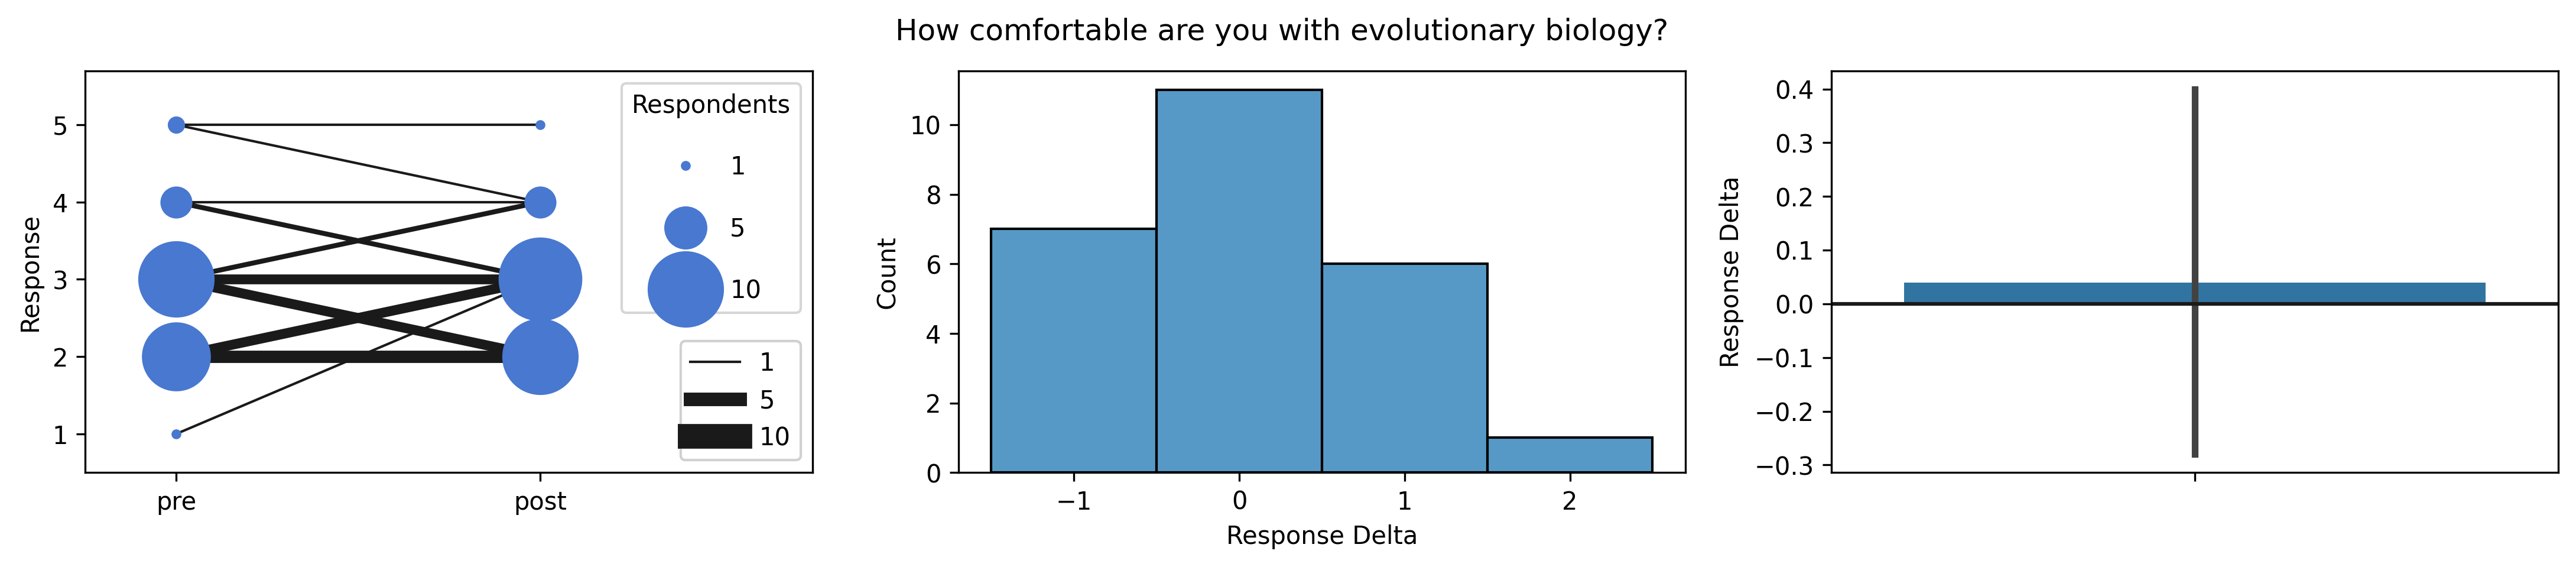 Figure SRETP.
Self-reported evolutionary thinking proficiency measured on workshop entry and exit surveys.
Error bar denotes bootstrapped 95% confidence interval.
Figure SRETP.
Self-reported evolutionary thinking proficiency measured on workshop entry and exit surveys.
Error bar denotes bootstrapped 95% confidence interval.
Figure SRETP shows nearly no change in participant evolutionary thinking over the course of the workshop. As before, this result suggests that improved enrichment content on evolution topics might benefit the workshop experience. However, this result might potentially be due to too-coarse response options as well.
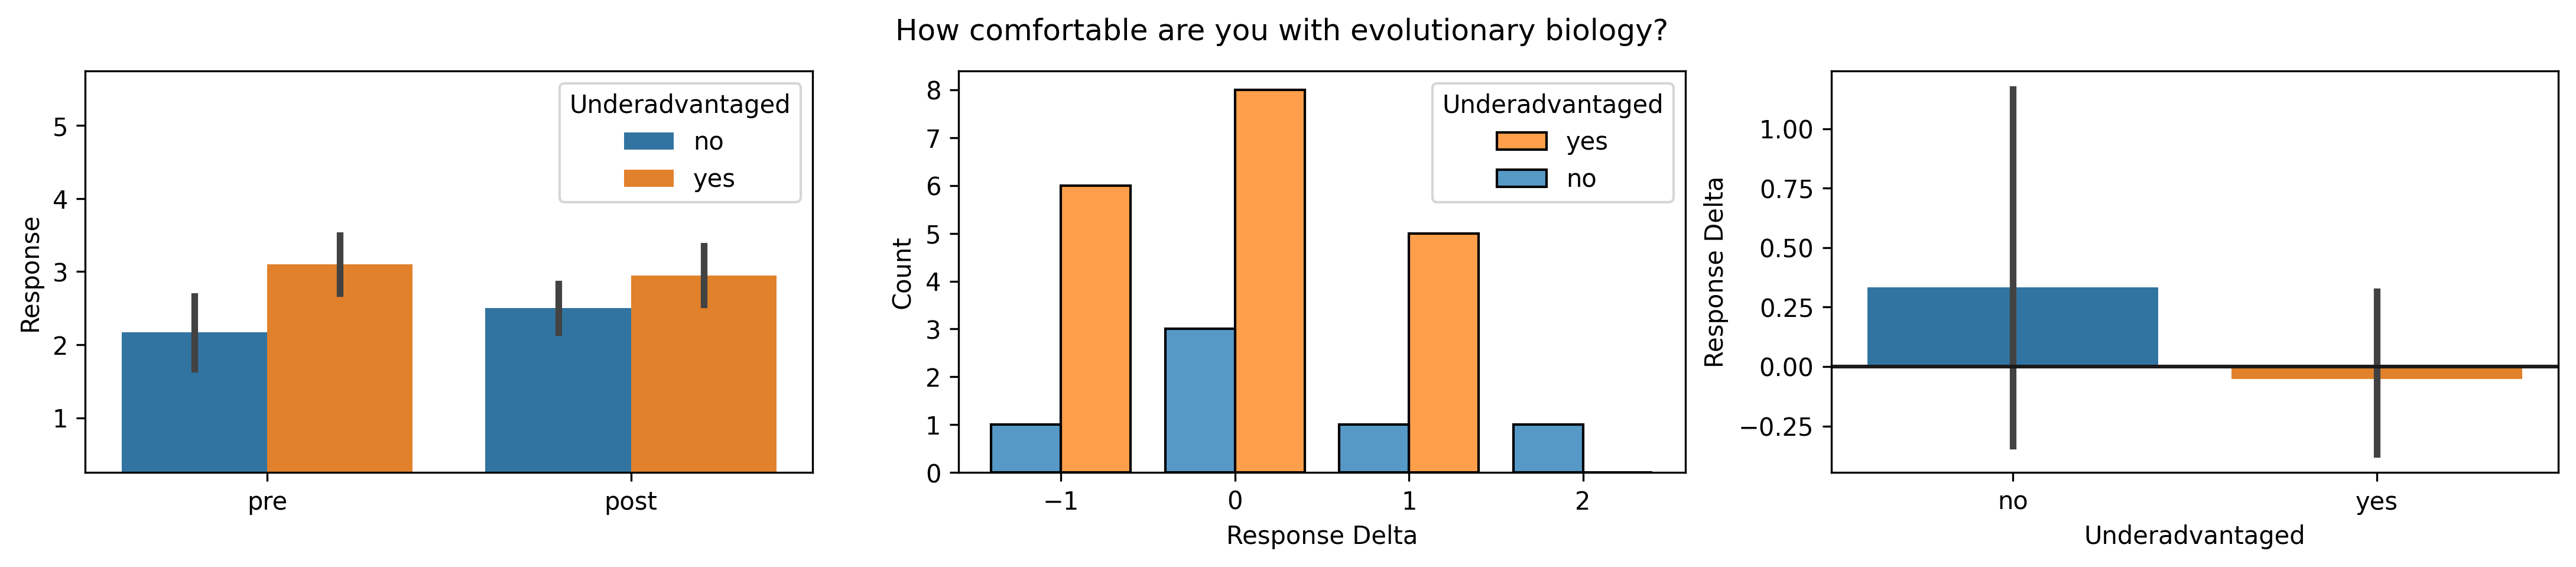 Figure DSRET.
Disaggregated self-reported evolutionary thinking proficiency measured on workshop entry and exit surveys.
Error bars denote bootstrapped 95% confidence interval.
Figure DSRET.
Disaggregated self-reported evolutionary thinking proficiency measured on workshop entry and exit surveys.
Error bars denote bootstrapped 95% confidence interval.
Disaggregating by underadvantaged status in Figure DSRET, we can see that underadvantaged students entered and exited with marginally higher mean proficiency with evolutionary thinking. However, non-underadvantaged students gained somewhat more proficiency over the course of the workshop.
🔗 Workshop Satisfaction
Finally, we asked 2021 participants to rate their overall satisfaction with the workshop according to the following scale.
How would you rate your experience with the workshop?
- Very satisfied
- Satisfied
- Neutral
- Dissatisfied
- Very dissatisfied
This question was not administered to 2020 participants.
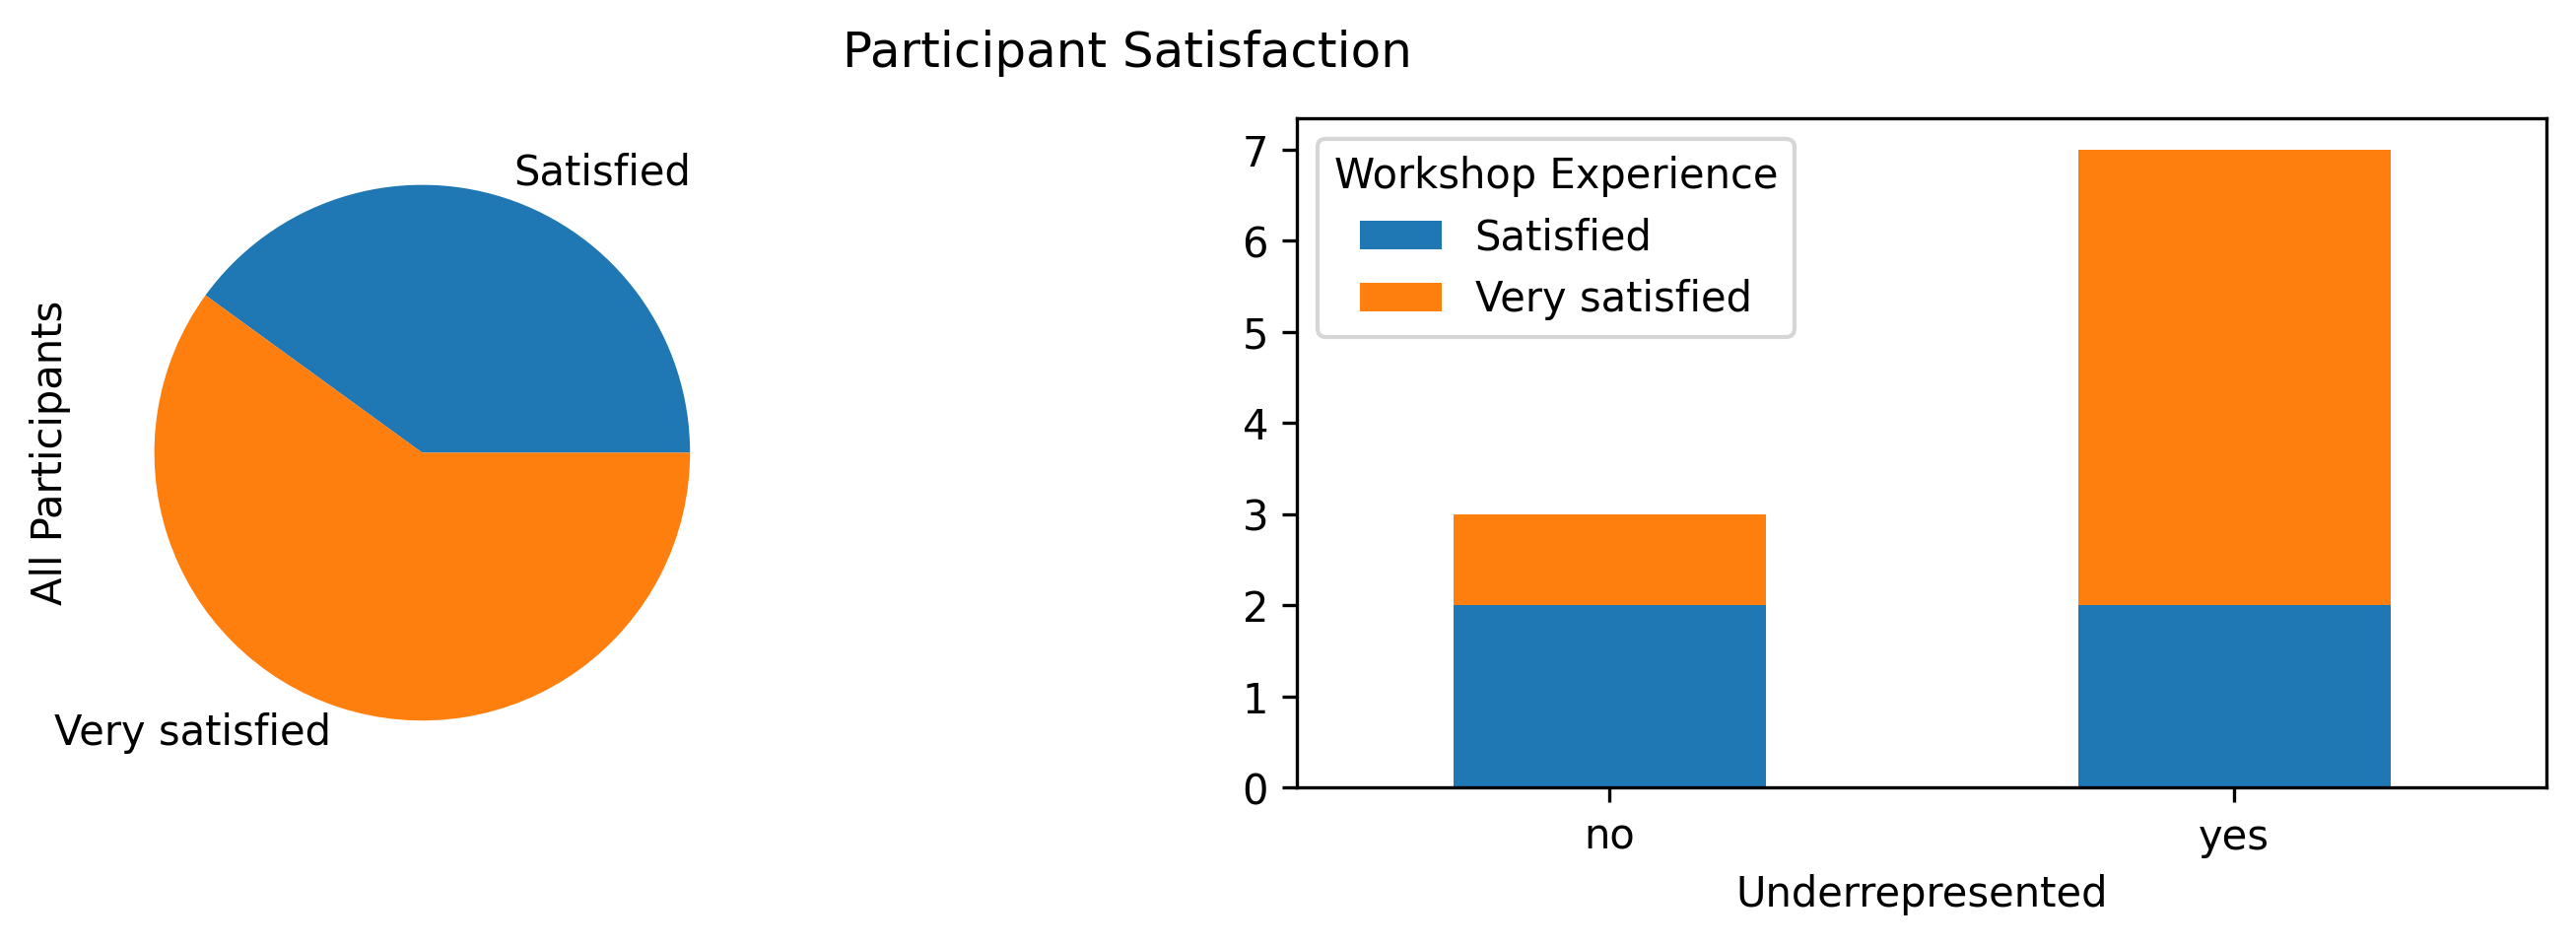 Figure SRPSM.
Self-reported participant satisfaction measured on workshop exit survey.
Note that workshop satisfaction data was only collected in 2021.
Figure SRPSM.
Self-reported participant satisfaction measured on workshop exit survey.
Note that workshop satisfaction data was only collected in 2021.
Figure SRPSM summarizes participant satisfaction with the workshop. All participants were “satisfied” or “very satisfied.” Six were “very satisfied” and four were “satisfied.”
Interestingly, disaggregating shows a higher fraction of members of an underadvantaged group rating themselves “very satisfied.” However, due to small sample size this result is not statistically significant (Fisher’s Exact Test).
🔗 Conclusion
Survey data suggests the WAVES workshop succeeded in building language-specific proficiency among participants, particularly with respect to “catching up” members of underadvantaged groups. However, survey data shows that the the workshop did not improve participant evolutionary thinking or overall self-assessed programming proficiency. This suggests areas for potential curriculum improvement if the workshop were to be offered again.
In future work with existing survey data, we are interested in studying the impact of adding social “warm-up” activities to enrichment seminars in 2021, particularly with respect to participants’ sense of community within the virtual workshop context. The potential relationship between strengthened professional social relationships and retention of members of underadvantaged groups makes this question particularly prescient (Merolla and Serpe, 2013).
We are also interested in comparing applicant demographic data collected in 2021 to the demographics of selected workshop participants in order to reflect on the workshop admissions process.
🔗 Data & Software
Survey data is stored on the Open Science Framework.
The data repository page can be accessed at https://osf.io/asf3b/ (DOI 10.17605/OSF.IO/ASF3B).
Raw survey response data and collated, coded (i.e., assigned numerical labels to survey responses), and partially anonymized data is contained within a protected sub-component of that project, located at https://osf.io/urv7w/.
We have pre- and post-workshop survey responses for all participants, except for one student from 2020 who we were not able to reach after the workshop concluded. Based on the pre-workshop survey data, this participant identified as a member of an underadvantaged group in computer science. This participant’s post-workshop survey data was excluded from all analyses because it was missing.
To minimize stereotype threat effects, participants self-reported demographic information as the final component of each survey (Steele and Aronson, 1995).
Data analyses are organized as a notebook, available on GitHub
🔗 Acknowledgment
This work is supported through Active LENS: Learning Evolution and the Nature of Science using Evolution in Action (NSF IUSE #1432563). Any opinions, findings, and conclusions or recommendations expressed in this material are those of the author(s) and do not necessarily reflect the views of the National Science Foundation.
This research was supported in part by NSF grants DEB-1655715 and DBI-0939454. This material is based upon work supported by the National Science Foundation Graduate Research Fellowship under Grant No. DGE-1424871. Any opinions, findings, and conclusions or recommendations expressed in this material are those of the author(s) and do not necessarily reflect the views of the National Science Foundation.