It's an evolution experiment where computer programs are evolving!
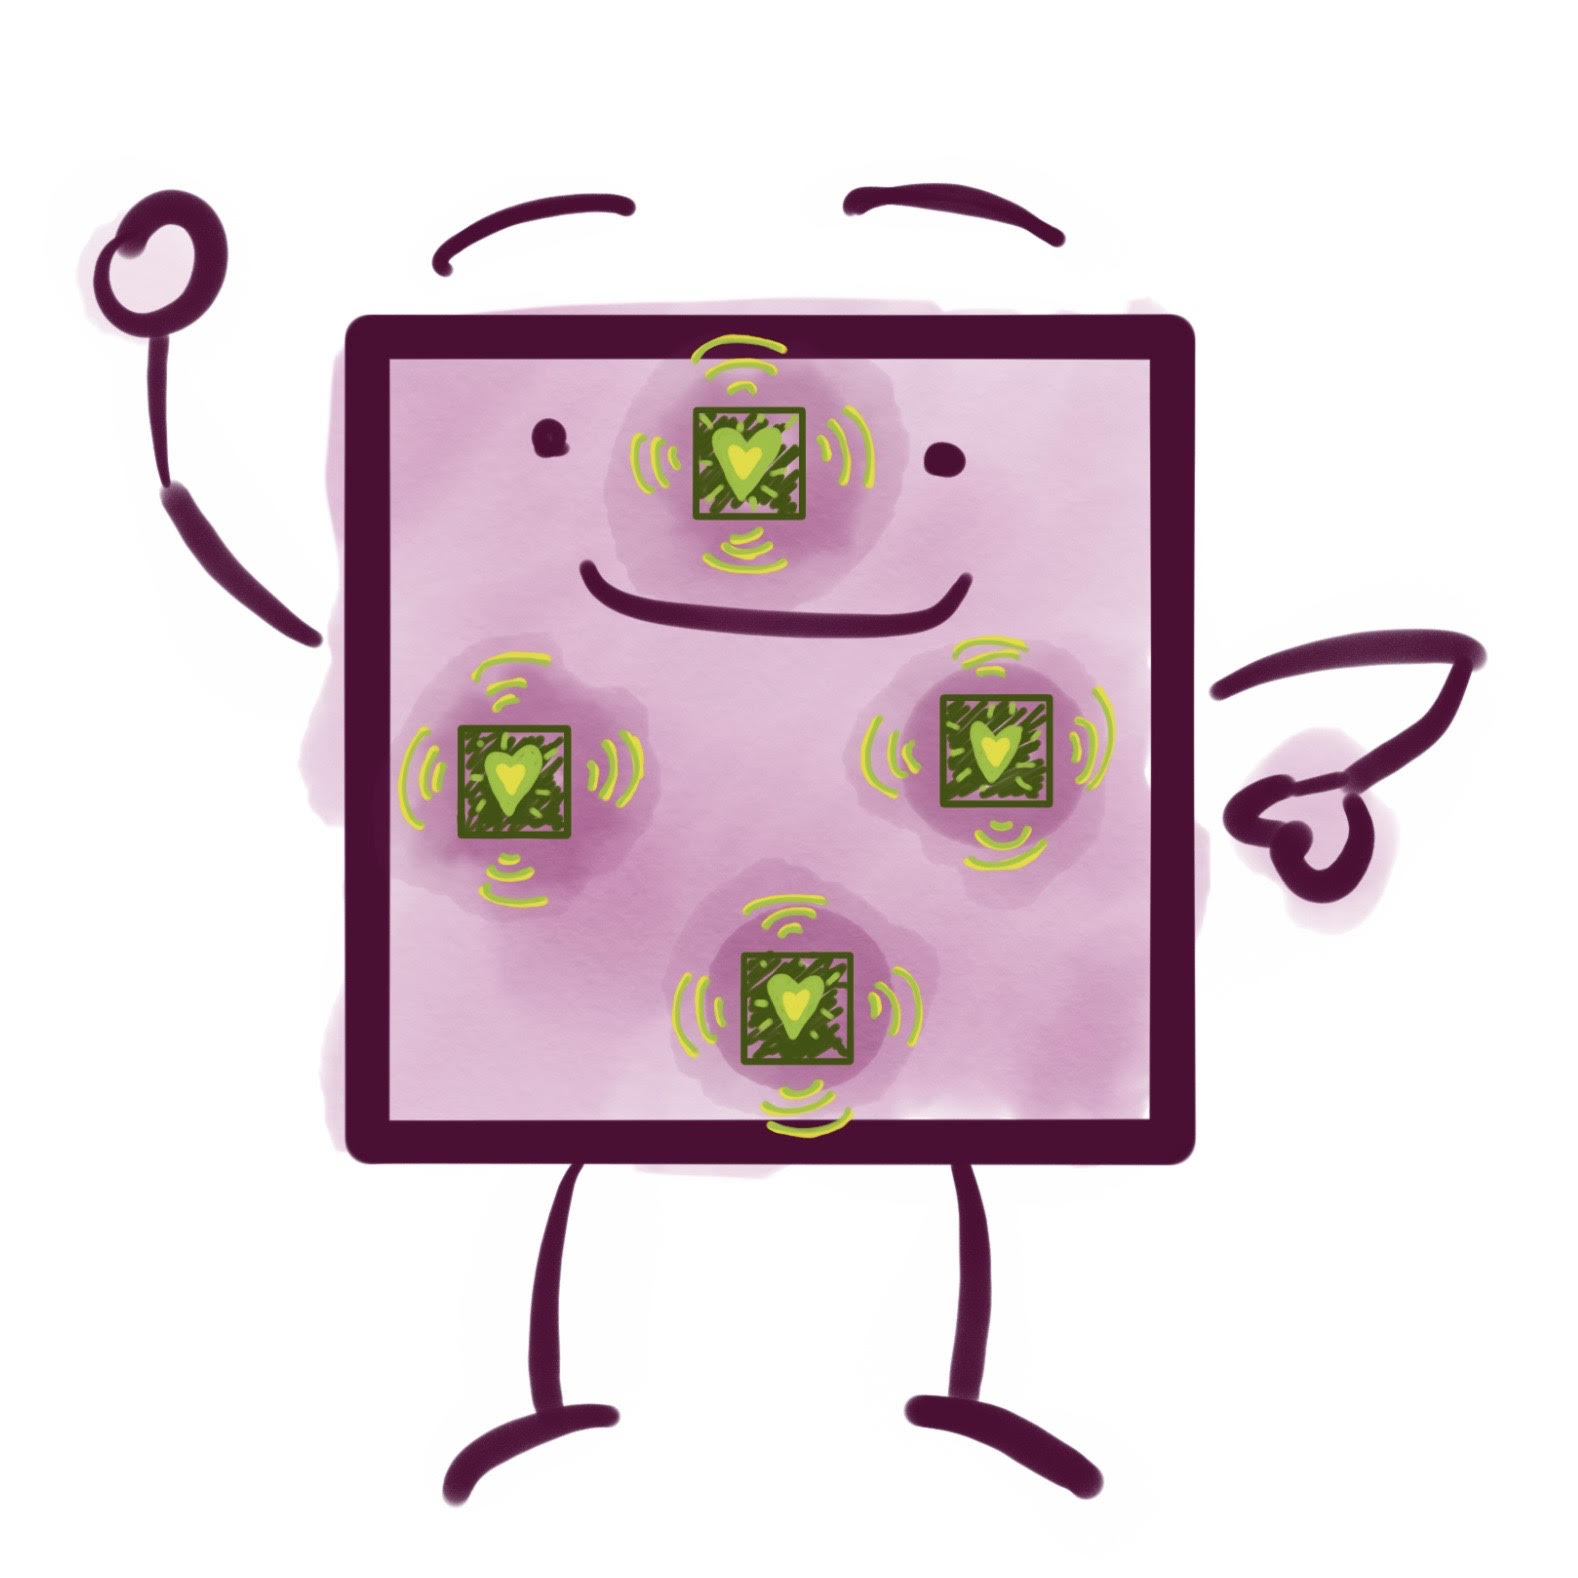
Each little grid title --- something like a biological cell --- is controlled by four virtual CPUs working in tandem (one for each side of the tile). Depending on the program loaded into the cell, different decisions are made in response to environmental events and messages from neighboring cells.
For those in the know, virtual CPUs are being implemented using SignalGP [Lalejini and Ofria, 2018].
These cells are presented with a cooperative resource collection task.
In order to maximize their resource-collection rate, they need to organize into family resource-collecting groups (which we call "channels") that are just the right size... not too big and not too small!
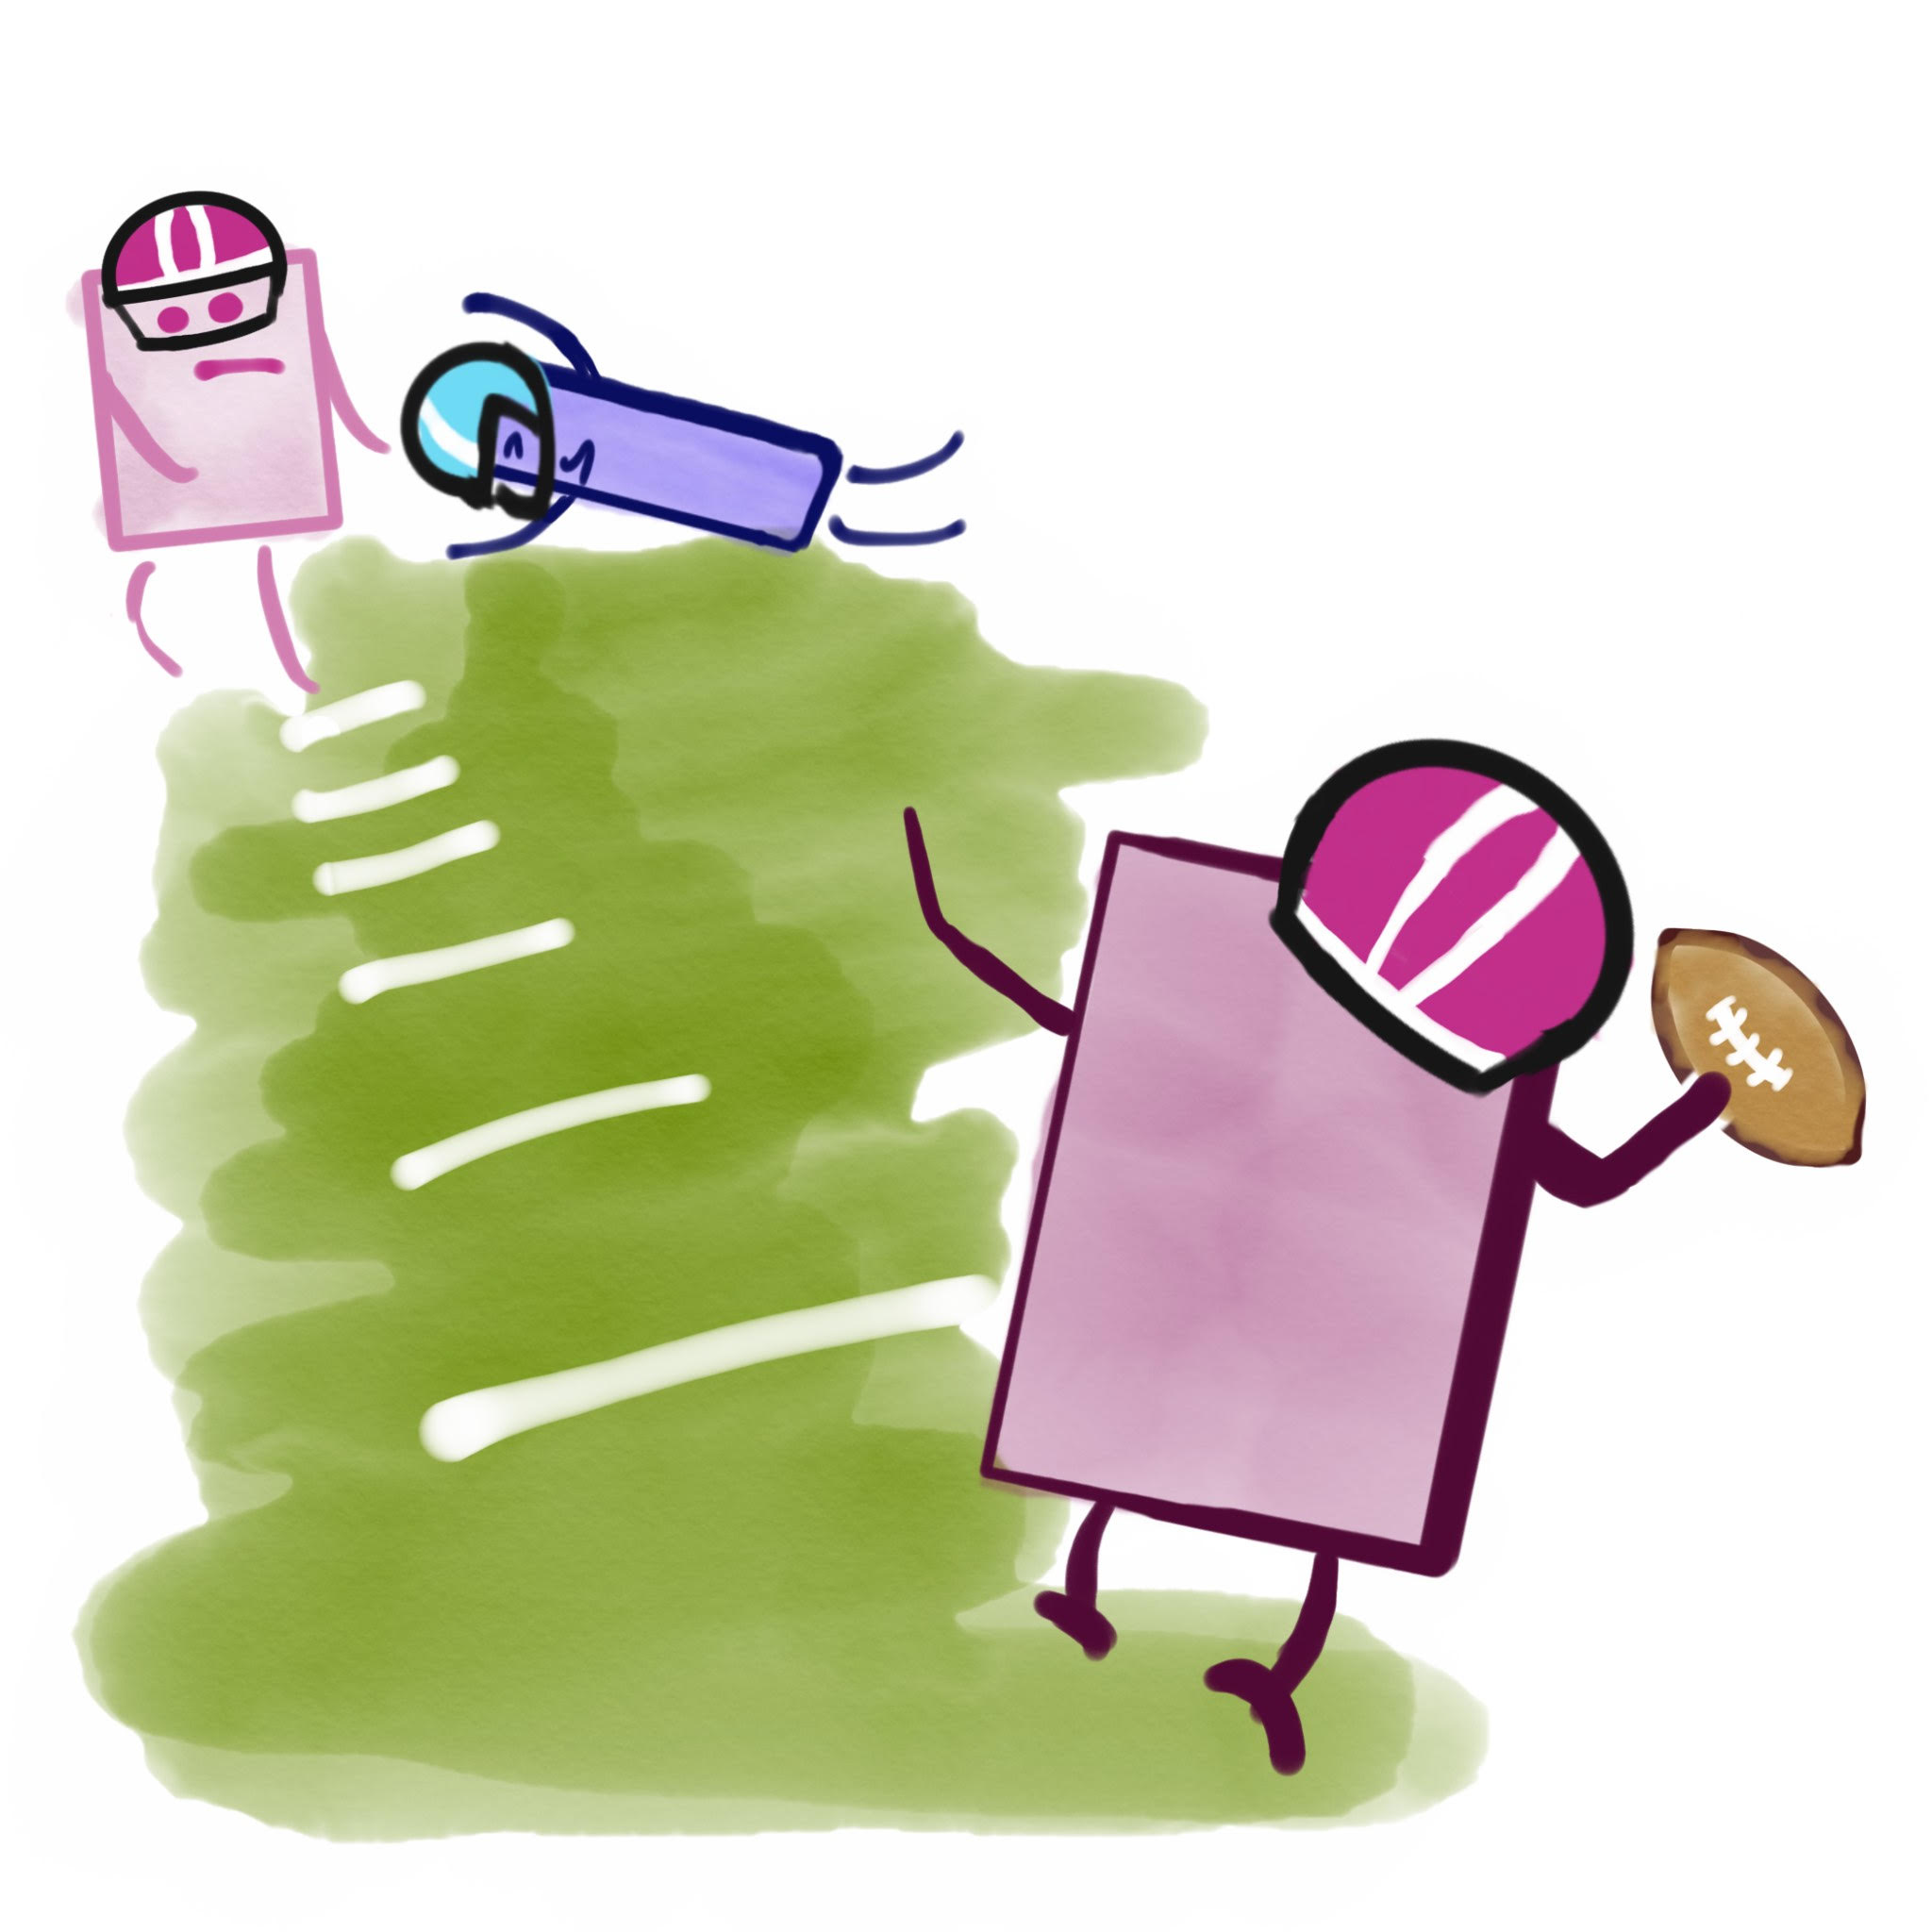
Better-configured resource-collecting groups will tend to outcompete other groups for space on the grid.
In order to maximize their resource-collection rate, they need to organize into family resource-collecting groups (which we call "channels") that are just the right size... not too big and not too small!
Better-configured resource-collecting groups will tend to outcompete other groups for space on the grid.

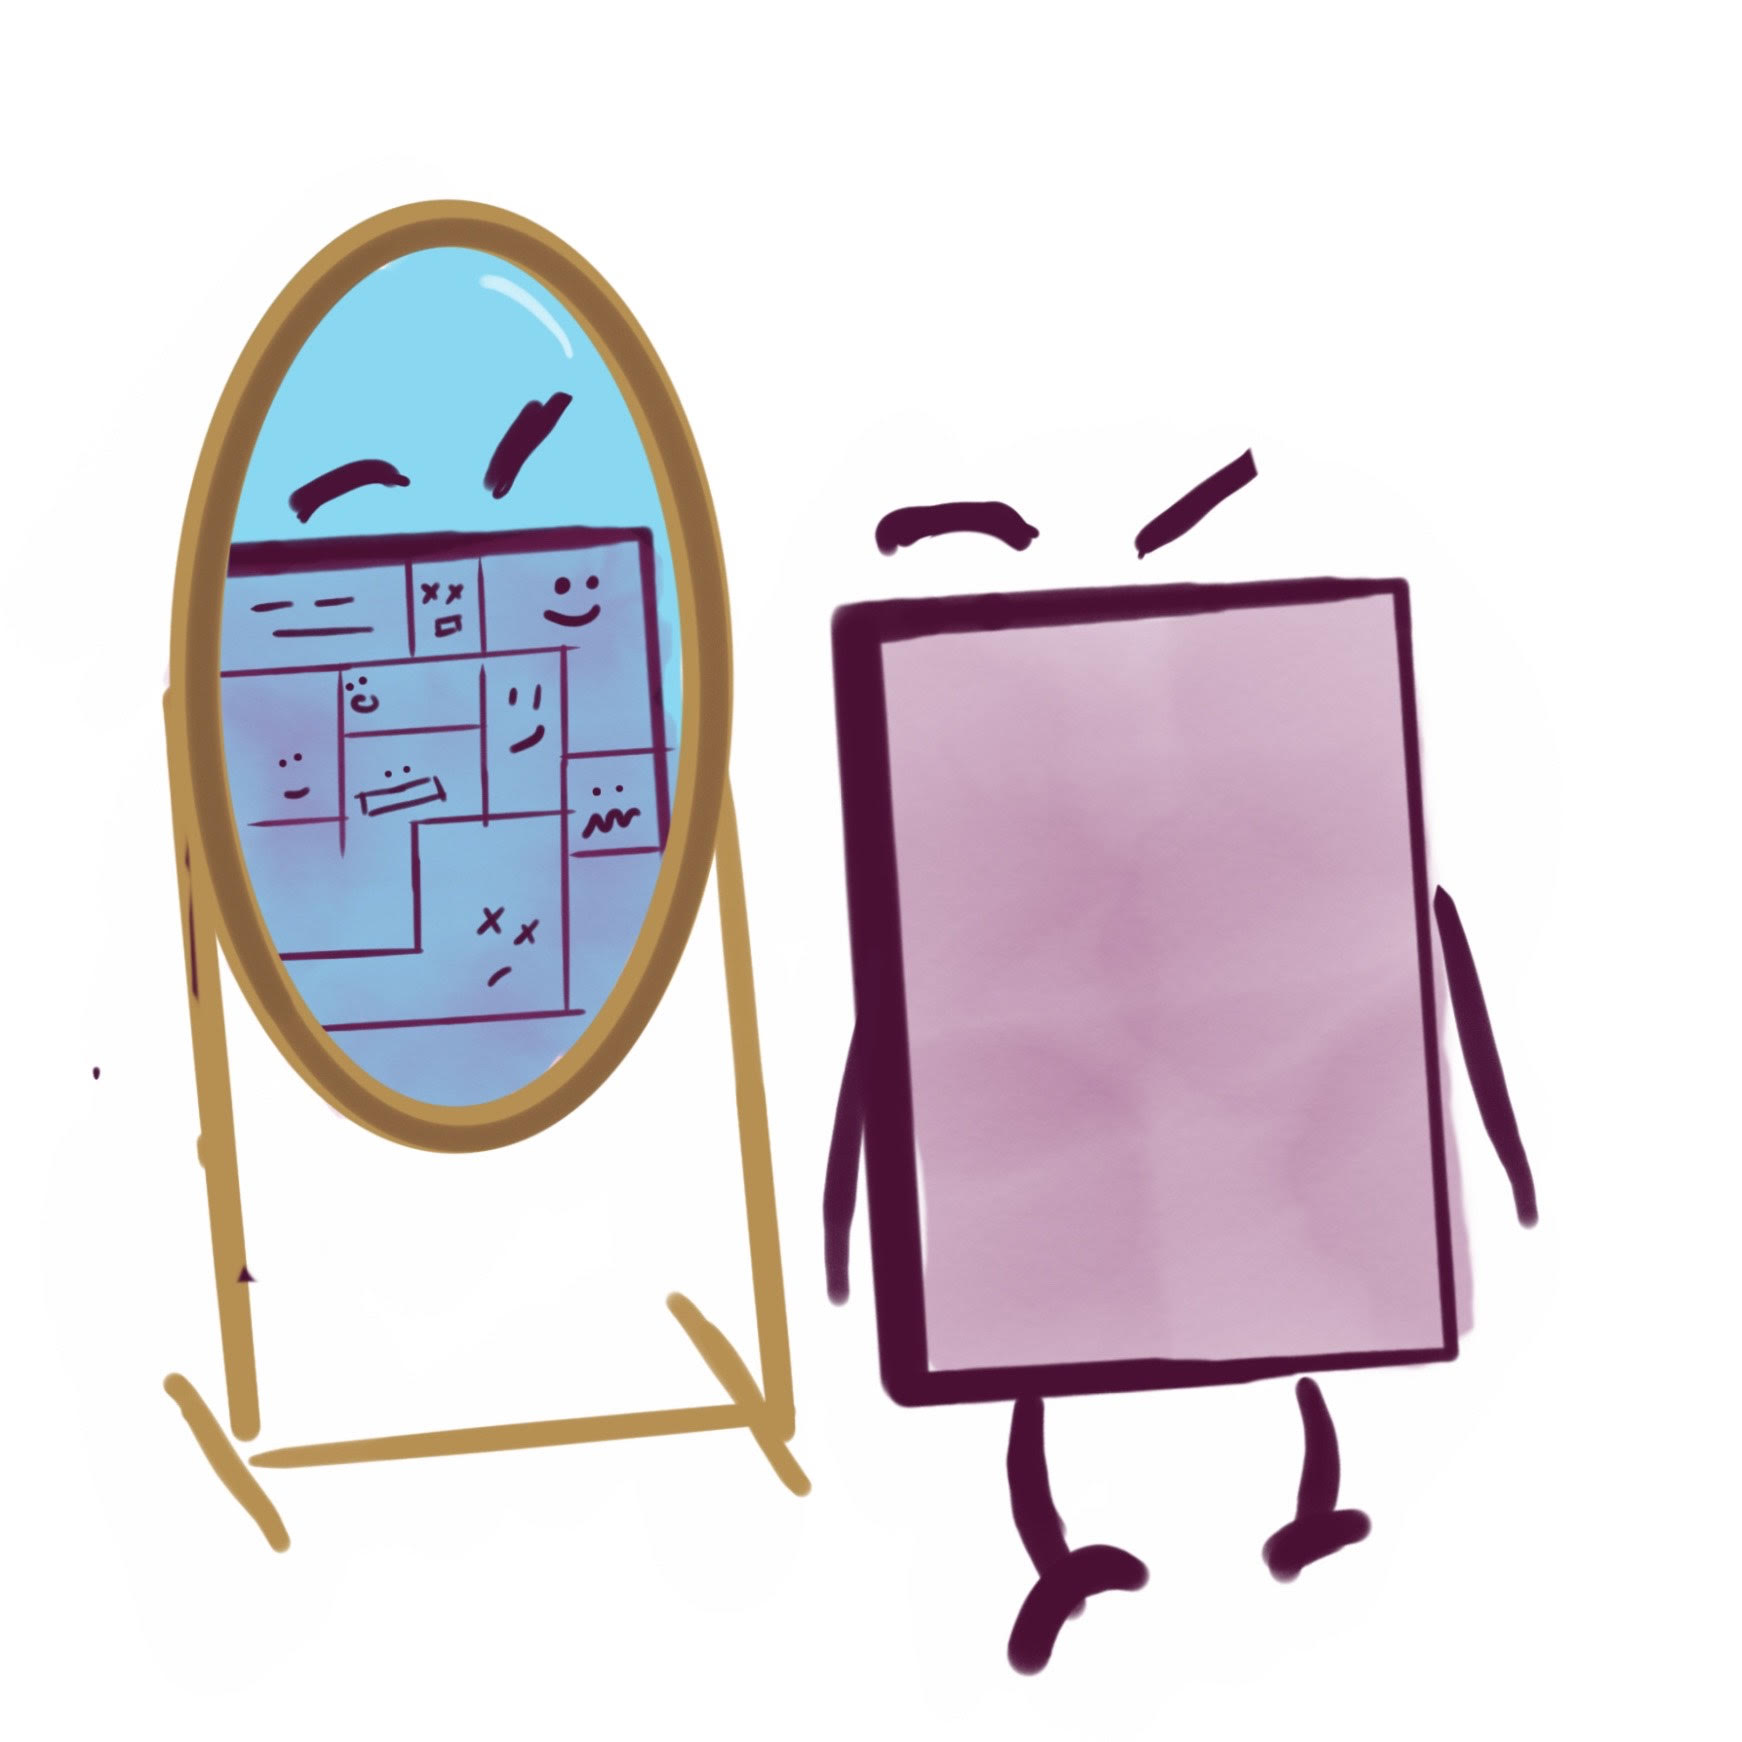
Cells use resource they collect to reproduce.
When a cell has enough resource, it can copy its program into a neighboring cell.
The copy isn't perfect, though... usually, the program changes slightly (mutates) during this process. My Darwin fanboys out there are probably onto it already, but
heritable variation + differential reproductive success (some programs are better at competing for space in the population) = ... evolution!
In previous work [Moreno and Ofria, 2019], we found that in response to this particular resource-collection task, strategies built on
Such traits are suggestive of multicellularity... or, in fancy science-speak a fraternal transition in individuality [Smith and Szathmary, 1997].
- reproductive division of labor,
- resource sharing between cells, and
- parental care for offspring
Such traits are suggestive of multicellularity... or, in fancy science-speak a fraternal transition in individuality [Smith and Szathmary, 1997].
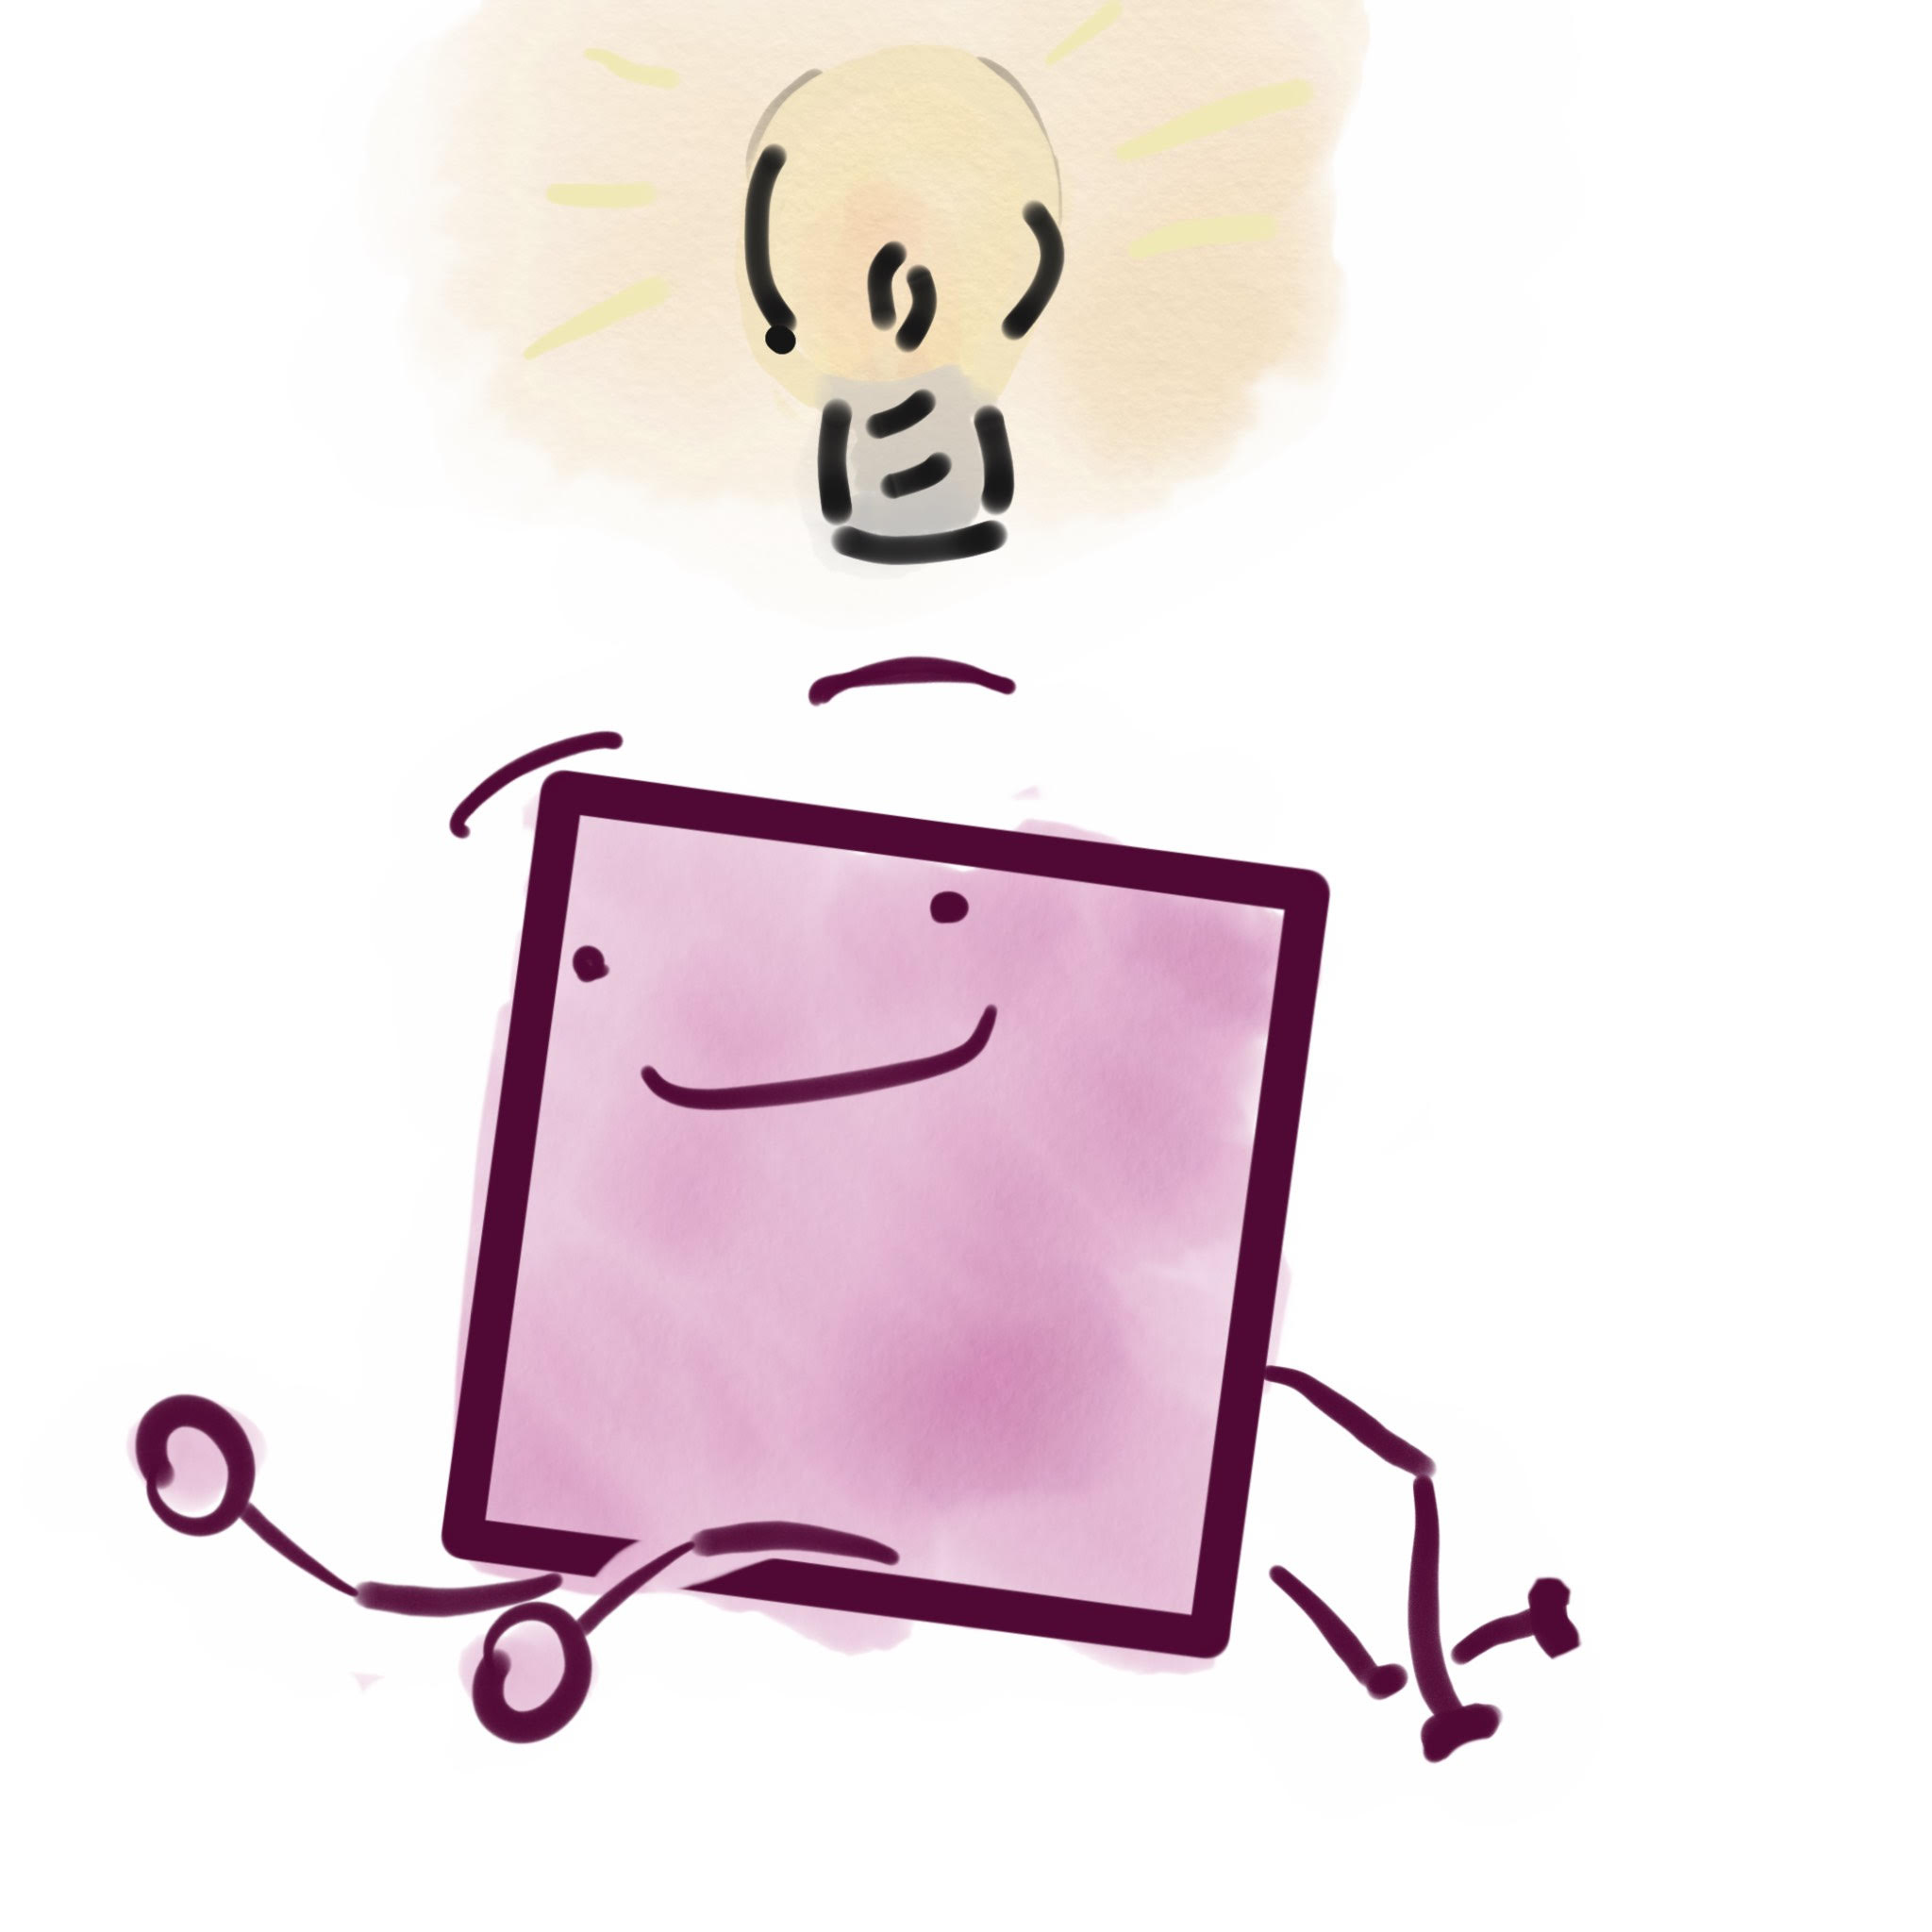
So, why do this type of thing at all?
On one hand, we're using this model to ask and answer scientific questions about the evolution of multicellularity in order to better understand the processes at play behind life on Earth.
On the other, we hope that transitions in individuality --- which were key to the complexification and diversification of life on Earth --- can help us evolve sophisticated --- and perhaps useful --- computational systems, like reinforcement-learning agents.

But this web viewer is here so you can get a peek at evolution in action!
We reccomend letting the simulation run maybe 10,000 updates with rendering off (so it runs faster). Then, render every update and look at
We reccomend letting the simulation run maybe 10,000 updates with rendering off (so it runs faster). Then, render every update and look at
- resource sharing in the Resource Sharing Viewer and
- signs of reproductive cooperation in the Reproductive Pause Viewer and Resource Stockpile Viewer.

And, for extra credit be sure to
- twiddle parameters in Configuration,
- look at a program in the Dominant Genotype viewer (... can you figure out what it evolved to do?),
- check out how the software is put together in Source & Ingredients, and
- click over to Let's Chat and let us know what you think!