Cluster Yourself Some Discussion Groups!
🔗 A Man,
Our Workshop for Avida-ED Software Development (WAVES) is underway into our third week!
We’ve got seventeen participants involved alongside nearly as many mentors. This adds up to around thirty pairs of hands on deck for group meetings! Our workshop is fully virtual, making the task of ensuring everyone is engaged and heard from especially challenging.
We decided to run our group meetings with a brief all-hands segment for announcements and group business then disperse into smaller breakout sessions for check-ins and questions. So, how to choose who goes in which breakout group?
Because we have a broad swath of project focuses represented in the group, it was essential to ensure that subgroups were organized to bring together related interests to facilitate deep, engaged conversation. However, the projects evaded easy heuristic categorization.
🔗 A Plan,
We decided to try clustering participants! We polled participants on the following categories of interest:
- HTML & CSS
- Data Visualizations
- MABE
- Bootstrap
- Systematics & Phylogenies
- Graduate school
- C++ runtime errors
- Template metaprogramming
- Public outreach
- Avida-ED
- Philosophy of science
- Careers in education
- Grid visualizations
- Experiment design
- JavaScript
- C++ compiler errors
- Careers in software development
- Compiling for web
- Empirical
- Genomes
- C++
- Pedagogy
- Object-oriented design
- User interface design
- Compiling for native
- Software Testing
![]() We used a Google form to collect binary check box responses with respect to each category.
We used a Google form to collect binary check box responses with respect to each category.
… (blah blah standard Scikit-learn k-means clustering ish) …
🔗 A Canal,
Without further ado, a visualization of our clustering result!
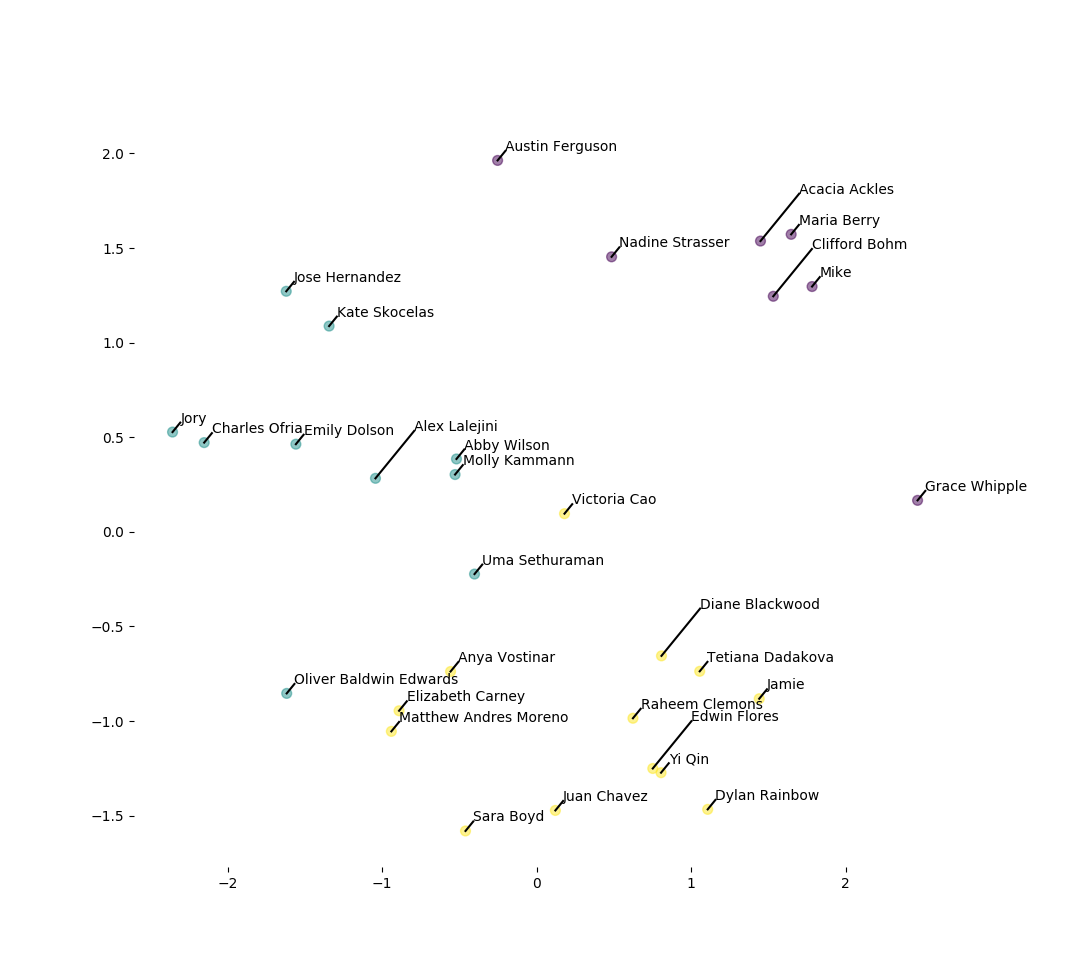
(Employing some standard Scikit-learn principal component analysis tosh for dimensionality reduction.)
The visualization ended up being useful for manual tweaking of group assignments to ensure that we had uniform ratios of mentors to participants across groups.
🔗 PANAMA!
Here’s the magic behind the curtain if you want to give it a try.
![]()
import pandas as pd
from sklearn.decomposition import PCA
from sklearn.cluster import KMeans
import matplotlib.pyplot as plt


df = pd.read_csv("file.tsv", sep="\t")

# extract unique categories
categories = {
  val.strip()
  for resp in df['Mark all categories of interest to you']
  for val in resp.split(',')
}

# transform into dataframe
# where columns are unique categories
# and rows are individuals
res = pd.DataFrame.from_records(
  [
    { category : category in response for category in categories }
    for name, response in zip(
      df['Name'],
      df['Mark all categories of interest to you'],
    )
  ]
)

# cluster using k-means
clustering = KMeans(n_clusters=3).fit(res)

print("preliminary group assignments")
print(zip(
  clustering.labels_,
  df['Name'],
))


# visualize clustering!

# use principal component analysis to reduce dimensionality
pca = PCA(n_components=2)
pca.fit(res)
df_pca = pca.transform(res)

# plot primary-component transform of individuals
x_values, y_values = df_pca.T
plt.scatter(
  x_values,
  y_values,
  c=clustering.labels_.astype(float),
  s=50,
  alpha=0.5,
)

# label names
for x, y, name in zip(x_values, y_values, df['Name']):
  # positions of some people's labels need nudging
  adjustment = 0.05 if name not in [
    'Acacia Ackles',
    'Diane Blackwood',
    'Edwin Flores',
    'Clifford Bohm',
    'Alex Lalejini',
  ] else 0.25
  # add connecting lines
  plt.plot(
    [x, x + adjustment,],
    [y, y + adjustment,],
    'black',
  )
  # annotate name text
  plt.gca().annotate(
    name,
    (
      x + adjustment,
      y + adjustment,
    ),
  )

# clean up and render
plt.box(on=None)
plt.show()
🔗 Let’s Chat!
What are your favorite mechanisms for forming discussion groups? What works? What doesn’t? Ever tried something similar to clustering?
I started a twitter thread (right below) so we can chat ![]()
![]()
![]()
⚠️WAVES workshop virtual meetings are BIG (30+)
— Matthew A Moreno (@MorenoMatthewA) June 9, 2020
🤔we should use breakout groups for weekly check-ins
⁉️but participants & projects defy clear heuristic categorization
💡let's cluster 'em!!!
🗣️seems to have set up good convos 🤷
⬇️ how (w/ code!) https://t.co/F6BksxzBGi pic.twitter.com/KSx0PYcAYx